
Box Plot Construction Example
Loading the math board and drawing, please wait…
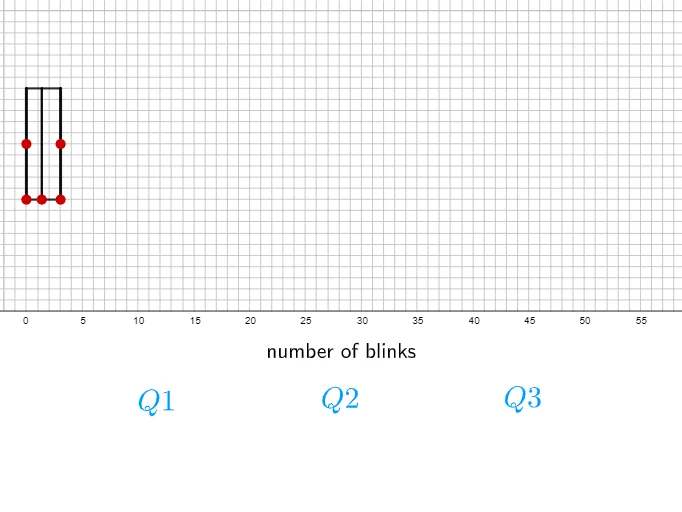
This example demonstrates how to create box plots using GeoGebra, visually representing data distribution features. Core math concepts include data statistics, five-number summary, median, quartiles, and outliers. Construction highlights from the summary involve commands like Polygon, Segment, Intersect, and objects such as d, e, A, B, etc. Suitable for middle school and above, ideal for teaching data visualization in probability & statistics units.
GeoGebra Commands & Parameters
Polygon(G, I, J, H) → q1, g, i, j, hPolygon(I, K, L, J) → q2, i_1, k, l, j_1Segment(R, F) → rSegment(Q, F) → sSegment(E, F) → fIntersect(h, f) → MSegment(M, E) → mSegment(N, E) → nSegment(O, E) → pIntersect(k, f) → PSegment(P, F) → q
AI Drawing Prompt Reference
Draw a box plot example: first create two adjacent rectangles representing interquartile ranges, then extend line segments above and below them as whiskers. From the rectangle vertices, draw vertical lines down to a horizontal baseline, creating multiple intersection points. From these points, connect line segments to the baseline ends or center, forming the whiskers and outlier markers. The overall figure shows the five-number summary of data distribution, including minimum, lower quartile, median, upper quartile, and maximum, clearly displaying central tendency and spread.
The prompt above was compiled from the original drawing commands and is for reference only.