
Binomial Distribution
Loading the math board and drawing, please wait…
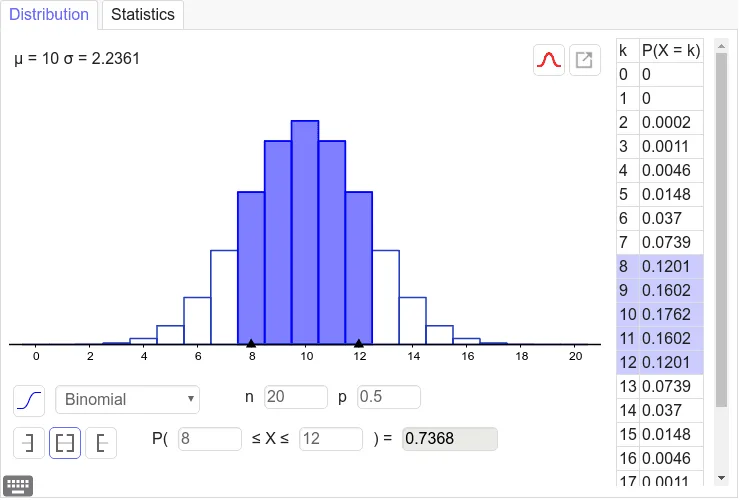
This example demonstrates the binomial distribution probability distribution. It involves the core mathematical concept of binomial distribution probability calculation. Using GeoGebra commands Sequence, Min, and Max, it dynamically shows the binomial distribution under different parameters. Suitable for high school probability and statistics courses.
GeoGebra Commands & Parameters
Sequence(20, 20, 0, 20) →Min(x(Point[xAxis]) + 1.5, x(Point[xAxis]) + 1.5) →Max(x(Point[xAxis]) + 1.5, x(Point[xAxis]) + 1.5) →
AI Drawing Prompt Reference
Draw a graph to demonstrate the binomial distribution probability, featuring a sequence that varies from 0 to 20 on the horizontal axis, with two conditions dynamically adjusting the sequence values to shift it by 1.5 units, resulting in a binomial distribution probability curve suitable for high school probability and statistics courses.
The prompt above was compiled from the original drawing commands and is for reference only.