
Binomial and Poisson Distributions by Hlho
Loading the math board and drawing, please wait…
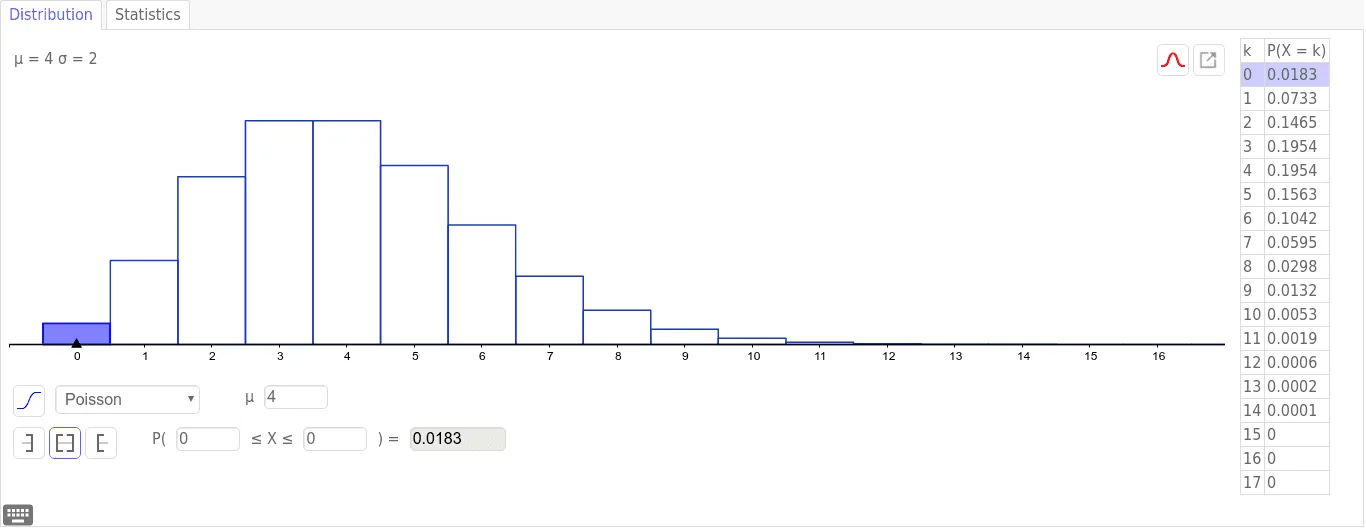
This example demonstrates the probability distribution graphs of the binomial and Poisson distributions and their parameter variations. The core math concepts involved include probability statistics, discrete distributions, mean, and variance. The construction highlights the use of GeoGebra commands: Sequence for generating distribution sequences, Min for determining minimum values, and Max for determining maximum values. It is suitable for high school and above students studying probability statistics to understand the characteristics and differences between different distribution models.
GeoGebra Commands & Parameters
Sequence(17, 17, 0, InversePoisson[4, 0.999999]) →Min(x(Point[xAxis]) + 1.5, x(Point[xAxis]) + 1.5) →Max(x(Point[xAxis]) + 1.5, x(Point[xAxis]) + 1.5) →