
Bayes Theorem Visualization
Loading the math board and drawing, please wait…
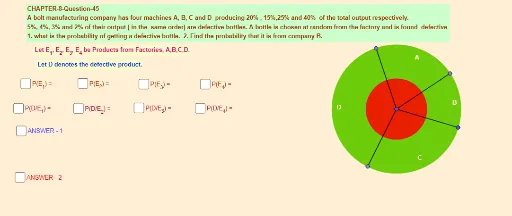
This example dynamically demonstrates Bayes' Theorem, visually illustrating the calculation of conditional probability. It involves core mathematical concepts like conditional probability, Bayes' Theorem, and probability theory. The construction uses GeoGebra commands such as Circle, Segment, Point, and Angle, along with text objects (text1-text19) for formulas and results. Suitable for high school and above learners to understand the core theorem and its applications in probability statistics.
GeoGebra Commands & Parameters
Circle(A, B) → cSegment(A, B) → fPoint(c) → CPoint(c) → DPoint(c) → ESegment(A, D) → gSegment(A, E) → hSegment(A, C) → iAngle(C, A, B) → αAngle(B, A, E) → βAngle(E, A, D) → γAngle(D, A, C) → δ