
Baseball Scatter Plot
Loading the math board and drawing, please wait…
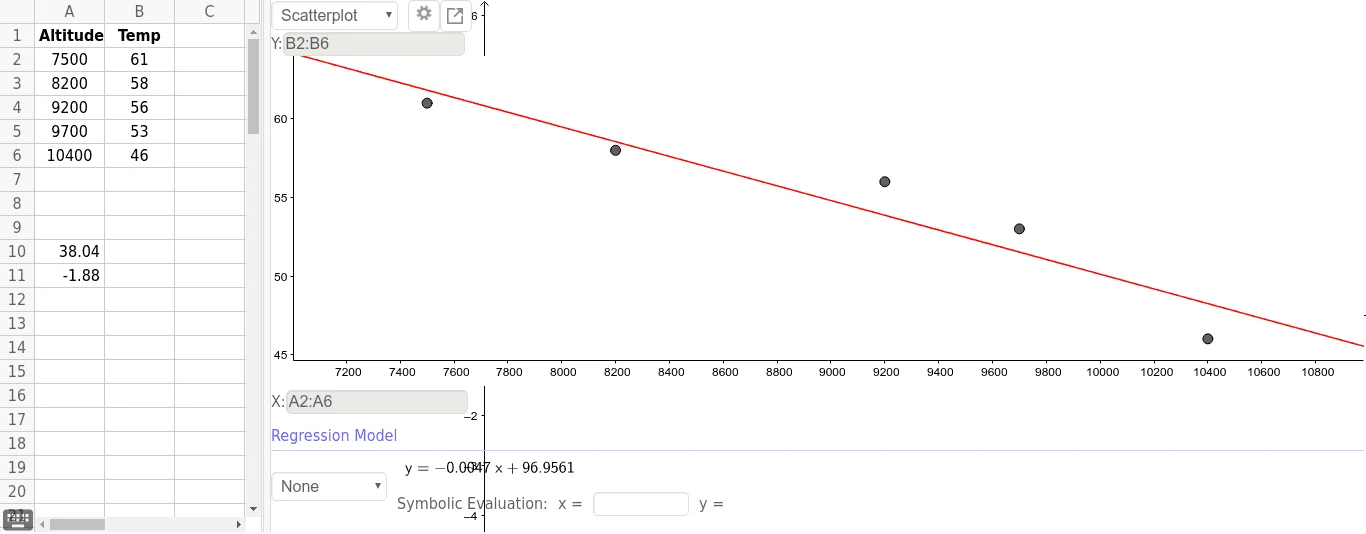
This example uses a scatter plot to demonstrate baseball batting data, involving correlation analysis. It uses the GeoGebra command ResidualPlot to draw a residual plot, involving objects such as A1, B1, A2, A3, A4, A5, A6, B2, B3, B4, B5, B6, A10, A11. Suitable for high school and above students or teachers for statistics education.
GeoGebra Commands & Parameters
ResidualPlot({(7500, 61), (8200, 58), (9200, 56), (9700, 53), (10400, 46)}, FitPoly[{(7500, 61), (8200, 58), (9200, 56), (9700, 53), (10400, 46)}, 1]) →
AI Drawing Prompt Reference
Create a scatter plot to display baseball batting data and draw a residual plot for correlation analysis, including data points for different years and a polynomial fit line, showing the distribution of data and the fitting effect with data points, trend line, and residual plot.
The prompt above was compiled from the original drawing commands and is for reference only.