
Area Bounded by a Polar Curve: Graph and Integral Sum Construction
Loading the math board and drawing, please wait…
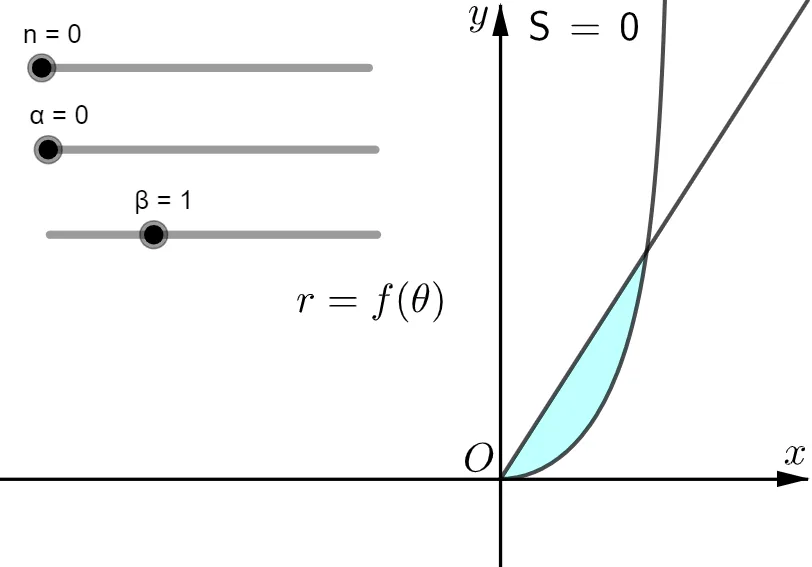
This example demonstrates how to visualize and compute the area enclosed by a polar curve within a specified angular range, using a constructive geometric approach. It highlights the key ideas of polar curves (parameterized by an angle θ), area under/inside a curve, and the link between definite integrals and numerical/segment summation (partition-and-sum approximation). In GeoGebra, the construction is built from rays and the curve (Ray, CurveCartesian), boundary/filled pieces (Polygon), and a generated sequence of sample points or partition elements (Sequence). The area approximation is accumulated using Sum over the discrete slices, while LaTeX labels annotate essential quantities such as angles (α, β, θ), the defining function f, partition markers (c1, c2), reference points (O), slice height terms (h), and parameters like n and Dt for the step size. Suitable for calculus and coordinate-geometry instruction, especially for learning the geometric meaning of integration and area computation via Riemann-sum style visualization.
GeoGebra Commands & Parameters
Ray(O, A) → hRay(O, B) → iCurveCartesian((f(θ); θ), θ, α, β) → cCurveCartesian((f(θ); θ), θ, α, β) → CCurveCartesian((f(θ); θ), θ, 0, (2 * π)) → b_{2}Polygon(O, B, A) → t1, a_{1}, d, b_1Sequence(Sector[x^(2) + y^(2) = f(α + ((i + 1) * Dt))^(2), ((f(α + ((i + 1) * Dt)) * cos(α + (i * Dt))), (f(α + ((i + 1) * Dt)) * sin(α + (i * Dt)))), ((f(α + ((i + 1) * Dt)) * cos(α + ((i + 1) * Dt))), (f(α + ((i + 1) * Dt)) * sin(α + ((i + 1) * Dt))))], i, 0, n - 1) → l1Sum(l1) → SLaTeX(S, true, true) → text2
AI Drawing Prompt Reference
Draw the area enclosed by a polar curve f(θ) within the angular range from α to β. First, draw two rays h and i from the pole O to points A and B, then plot the polar curve c and C. Next, draw sectors l1 and sum their areas to get S.
The prompt above was compiled from the original drawing commands and is for reference only.