
Approximating the Derivative
Loading the math board and drawing, please wait…
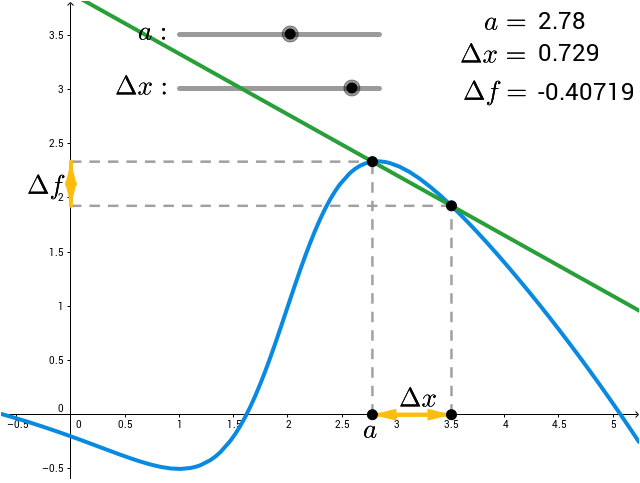
This example demonstrates how to approximate the derivative of a given function within the interval [0,5] using the difference quotient. Key math concepts include derivatives, difference quotient, and function graphing. Constructed with GeoGebra commands like Line, Segment, Vector. Suitable for high school mathematics teaching or self-learning to understand the geometric meaning of derivatives and the approximation principle of difference quotient.
GeoGebra Commands & Parameters
Line(C, Cdx) → aSegment((aval, 0), (aval, g(aval))) → hSegment((aval + dx, 0), (aval + dx, g(aval + dx))) → iSegment((0, g(aval)), (aval, g(aval))) → lSegment((0, g(aval + dx)), (aval + dx, g(aval + dx))) → nVector((0, g(aval + dx)), (0, g(aval))) → cVector((aval, 0), (aval + dx, 0)) → uVector((aval + dx, 0), (aval, 0)) → vVector((0, g(aval)), (0, g(aval + dx))) → w
AI Drawing Prompt Reference
Draw a function graph on the interval [0,5] and approximate its derivative using the difference quotient. First, plot the function curve, then mark two points and connect them to the x-axis to form two triangles. Next, draw the diagonals of these triangles and label the perpendicular vectors to the x-axis to show the geometric meaning of the difference quotient.
The prompt above was compiled from the original drawing commands and is for reference only.