
Applying Quadratics Functions
Loading the math board and drawing, please wait…
In collections
Finding Equations for Polynomials
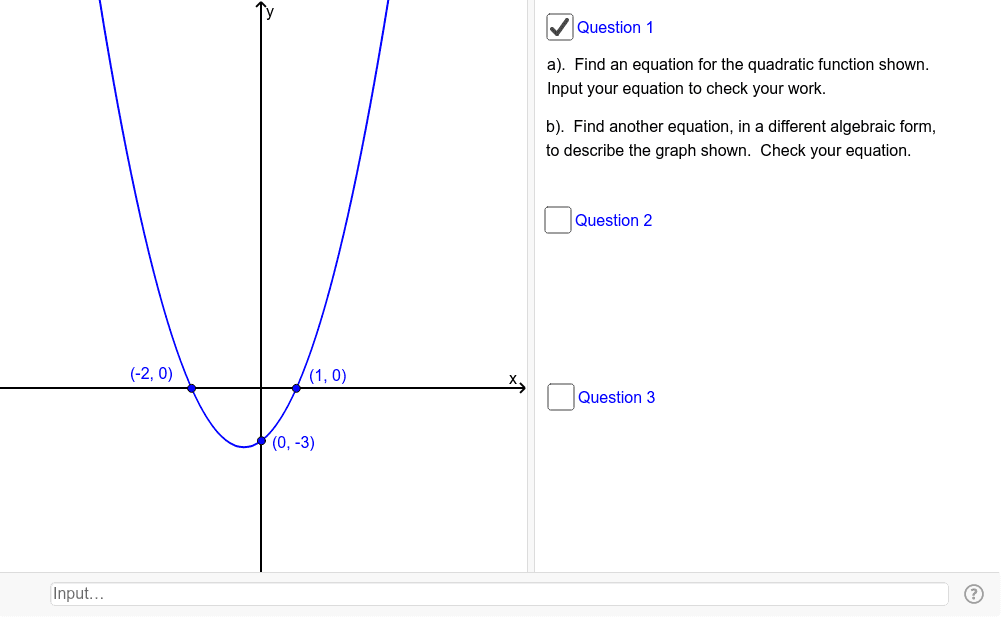
This example demonstrates how to use GeoGebra to plot and analyze quadratic function graphs along with related geometric elements. Core math concepts include quadratic functions, coordinate geometry, complex numbers, and similar triangles. Construction highlights involve GeoGebra commands like c, text1, text2, text3, A, B, C, a, d, D, E, F, e, f, G, H, text3_1, b. Suitable for high school mathematics teaching or student exploration of quadratic function properties.
GeoGebra Commands & Parameters
Conic cPoint A(-2, 0)Point B(1, 0)Point C(0, -3)Boolean a(true)Conic dPoint D(-1, 0)Point E(5, 0)Point F(2, 18)Boolean e(false)y = x^(2) + (6 * x) + 13(-3, 4)(0, 13)Boolean b(false)
AI Drawing Prompt Reference
Draw a graph showing quadratic function plots and related geometric elements, including coordinate geometry and complex numbers. Plot two parabolas passing through specified points and label them. Mark key points in the coordinate system and add text annotations explaining the properties of quadratic functions and the relationships between geometric elements.
The prompt above was compiled from the original drawing commands and is for reference only.