
Anja Greer Workshop 2017: Derivative of sin(x)
Loading the math board and drawing, please wait…
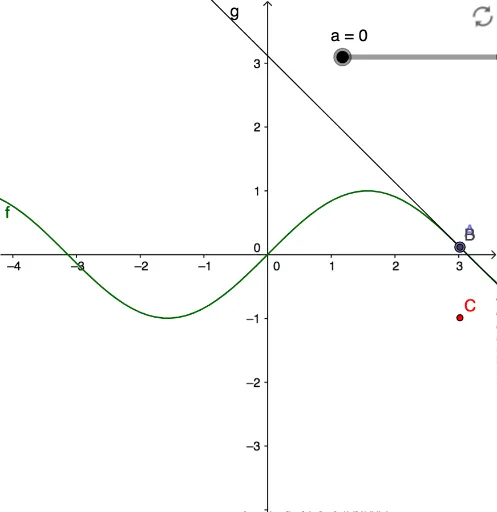
This GeoGebra example dynamically illustrates the geometric meaning of the derivative of the sine function sin(x), showing how the slope of the tangent line at a point on the curve changes as the point moves. The core mathematical concepts include the definition and geometric interpretation of derivatives, trigonometric functions, tangent lines, limit ideas, and rates of change of functions. Construction highlights: based on the summary, it uses the Point command to create key points A, B, C, and the Line command to draw the tangent line g, while defining the function f (sine) and line a among other objects. By dragging points, learners can observe the relationship between the tangent slope and the derivative function. This is suitable for high school or early college students beginning calculus, and can be used for classroom demonstrations or self-directed exploration to build intuition about derivatives and function graphs.
GeoGebra Commands & Parameters
Point(f) → ALine(A, B) → g
AI Drawing Prompt Reference
Draw the graph of the sine function sin(x), and select any point A on the graph. Draw the tangent line at point A. Observe how the slope of the tangent line changes as point A moves, to understand the geometric meaning of the derivative.
The prompt above was compiled from the original drawing commands and is for reference only.