
Amplitude and Period of Sine Function
Loading the math board and drawing, please wait…
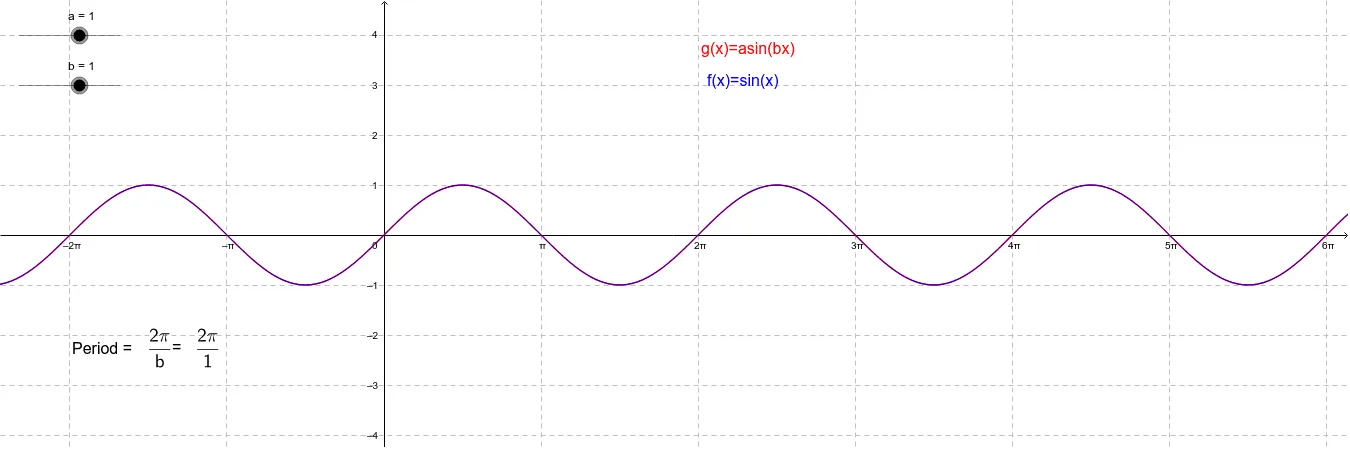
This example investigates changes in the sine function's graph by adjusting its amplitude and period. Key mathematical concepts include trigonometry, amplitude, and period. It uses GeoGebra objects such as text, function, and slider for construction. Suitable for high school mathematics education and learning.
GeoGebra Commands & Parameters
Numeric a(1.0)Numeric b(1.0)Numeric c(0.0)Numeric d(0.0)f(x) = a * sin(b * x - c) + dg(x) = sin(x)
AI Drawing Prompt Reference
Draw a sine function graph and adjust its amplitude and period. Use an amplitude slider a, a period slider b, a phase slider c, and a vertical shift slider d. The amplitude slider a controls the amplitude of the function, the period slider b controls the period, the phase slider c controls the phase, and the vertical shift slider d controls the vertical shift. Initially, set amplitude to 1, period to 1, phase to 0, and vertical shift to 0. Finally, draw the standard sine function y=sin(x) for comparison.
The prompt above was compiled from the original drawing commands and is for reference only.