
Algebra 2: Exponential Function Modeling Example
Loading the math board and drawing, please wait…
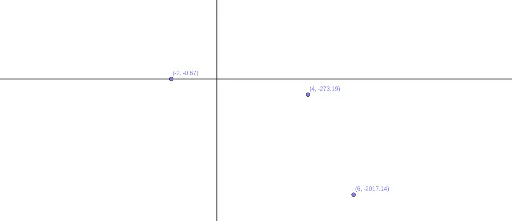
This example demonstrates how to model exponential functions using GeoGebra. It covers key mathematical concepts such as the properties of exponential functions and their applications in real-world problems. By constructing points and function objects, users can visually understand the characteristics of exponential function graphs. Suitable for Algebra 2 courses.
GeoGebra Commands & Parameters
Point(f) → APoint(f) → BPoint(f) → C
AI Drawing Prompt Reference
Draw an exponential function graph by selecting three points on it to demonstrate its characteristics. First input the exponential function expression, then select three points on the curve to observe how these points change with the exponential function.
The prompt above was compiled from the original drawing commands and is for reference only.