
Adjusted SIR Model
Loading the math board and drawing, please wait…
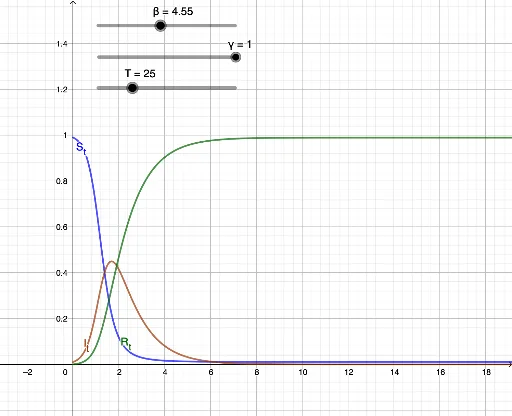
This example demonstrates the dynamic behavior of an SIR model (Susceptible-Infected-Recovered) with slight parameter adjustments. Key mathematical concepts include differential equations, parameter tuning, and data visualization via bar charts. The construction leverages the NSolveODE command to solve differential equations, sliders for adjusting parameters like population size (N), infection rate (β), removal rate (γ), and time (T), along with initial conditions (I_0, S_0, R_0), and plots the evolution of S', I', R' over time (S_t, I_t, R_t). Suitable for high school students and above or related educational purposes.
GeoGebra Commands & Parameters
NSolveODE({S', I', R'}, 0, {S_0, I_0, R_0}, T) → S_t, I_t, R_t