
Adding Fractions Visualized with Bar Charts and Pie Charts
Loading the math board and drawing, please wait…
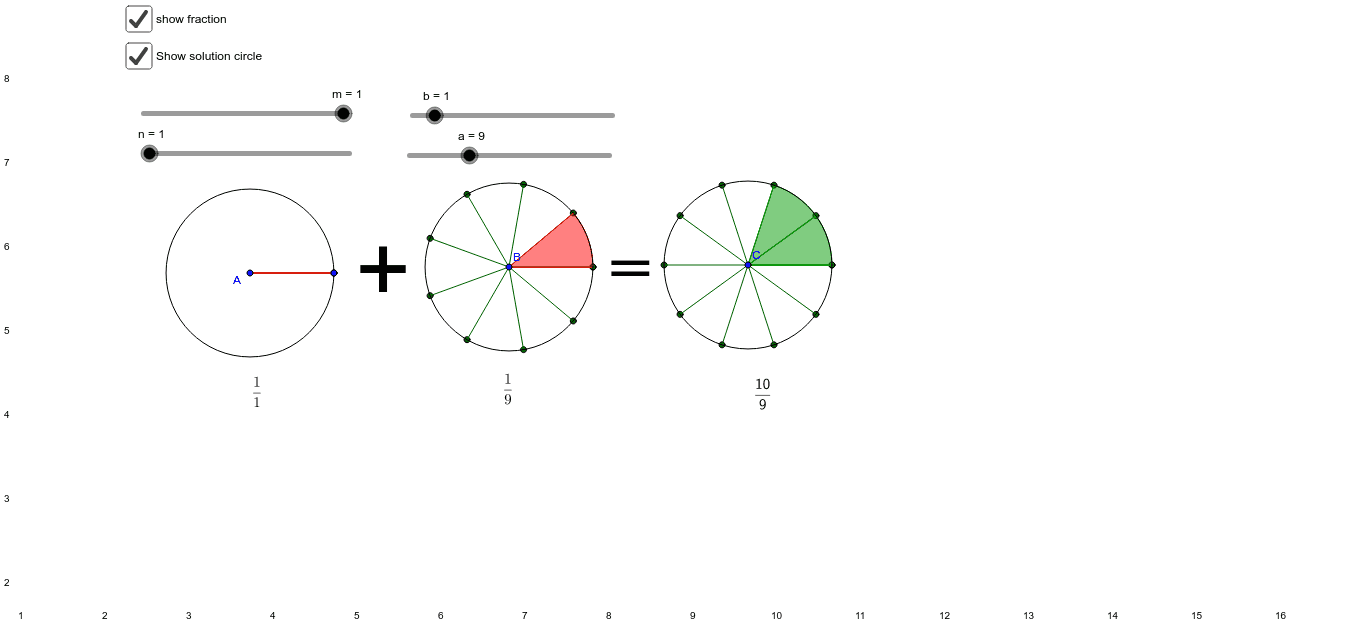
This GeoGebra example demonstrates the addition of fractions through dynamic visual representations, combining bar charts and pie charts to make the process intuitive. The core mathematical concepts include fraction meaning, common denominators, addition of fractions, and arithmetic mean. The construction uses commands such as Sequence, Element, Circle, and Pie to generate graphical elements, along with multiple lists (list1 to list9) to store numerical and textual data. FormulaText is employed to dynamically create fraction expressions, and sliders allow interactive adjustment of numerators and denominators. This resource is suitable for upper elementary and middle school students learning fraction addition, as well as for teachers to illustrate the concept of equivalent fractions and common denominators in the classroom.
GeoGebra Commands & Parameters
Sequence(A + ℯ^((((2 * π) * ί) * t)), t, 0, 1, 1 / n) → list1Element(list1, m + 1) → z_1Sequence(Segment[A, A + ℯ^((((2 * π) * ί) * t))], t, 0, 1, 1 / n) → list2Circle(A, 1) → cSequence(CircleSector[A, Element[list1, t], Element[list1, t + 1]], t, 1, m) → list3Pie(B, a, b) → list4, list5, list6, d_1Pie(C, n + a, m + b) → list7, list8, list9, f
AI Drawing Prompt Reference
Visualize fraction addition with bar charts and pie charts, adjusting numerators and denominators with sliders. Generate multiple sectors and bars using sequences, start by drawing basic circles and sectors, then combine them to show fraction representations, and finally use pie charts to illustrate the sum of two fractions, emphasizing the concept of common denominators.
The prompt above was compiled from the original drawing commands and is for reference only.