
Actors Boxplot
Loading the math board and drawing, please wait…
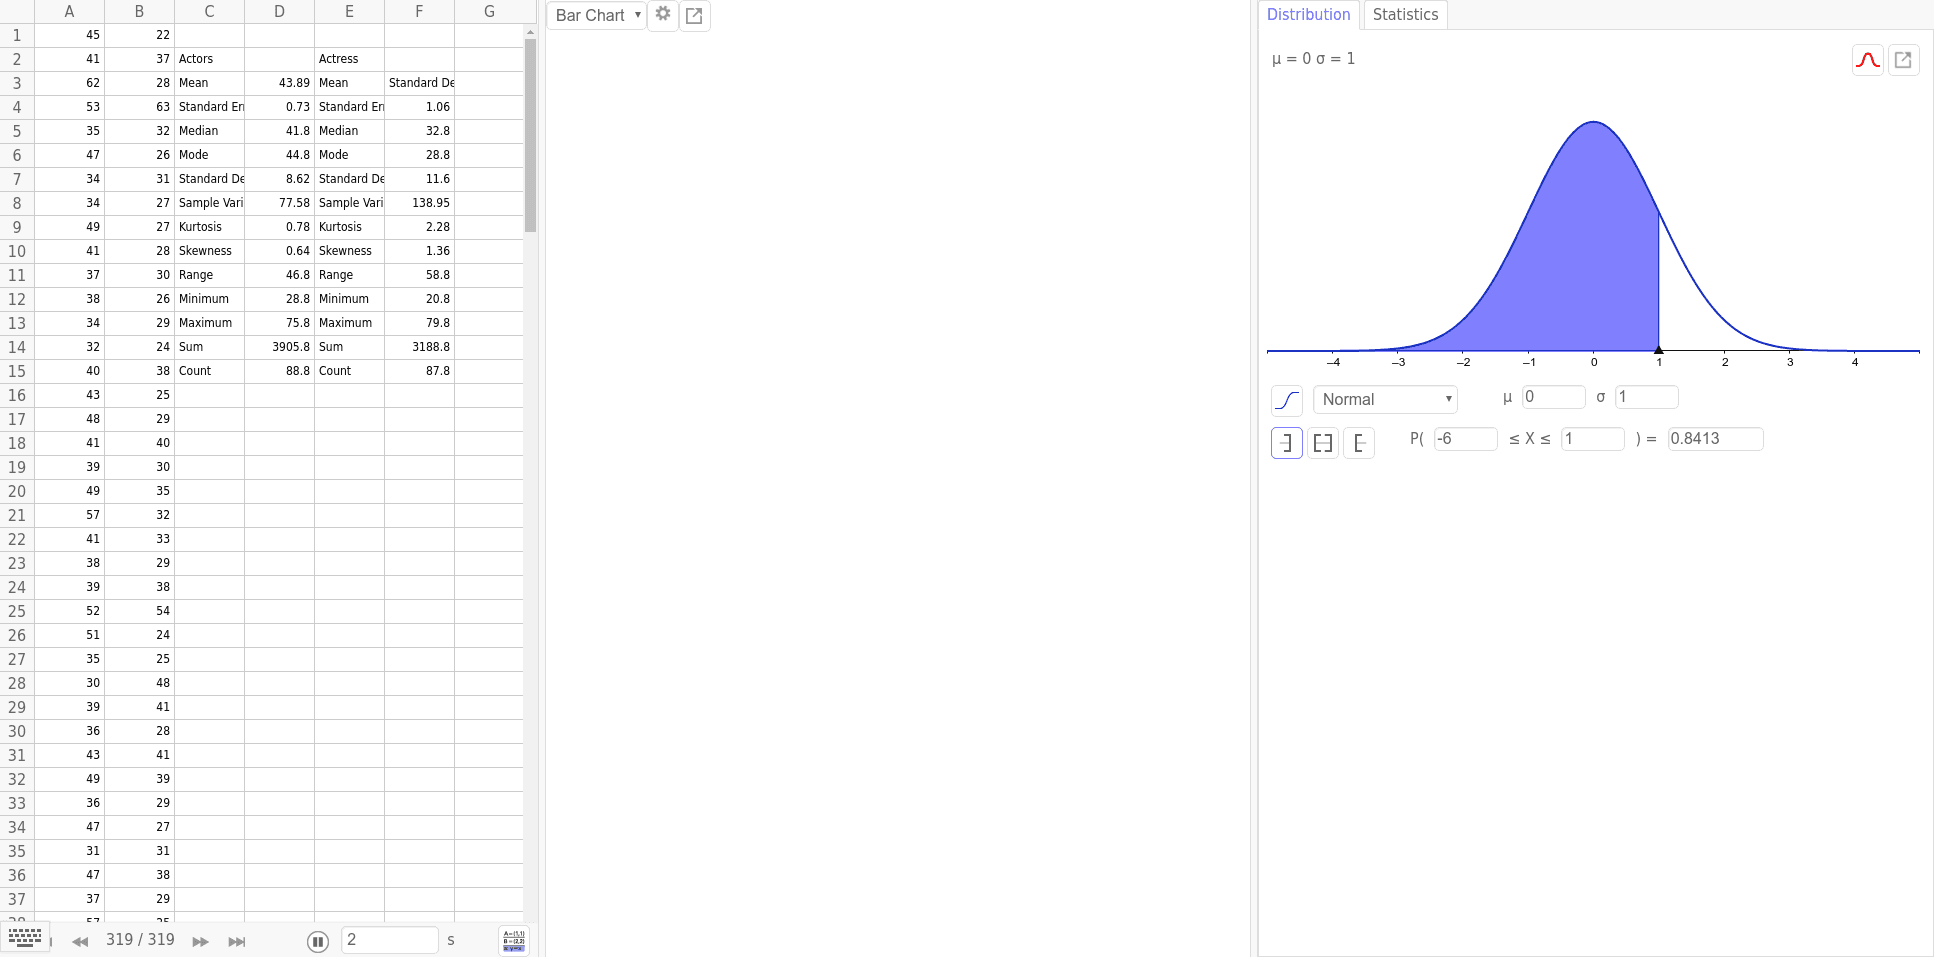
This example demonstrates how to use GeoGebra to create a boxplot for a set of data, visually representing the distribution. Key math concepts include data statistics, boxplot construction, median, quartiles, and outlier identification. Construction highlights involve using GeoGebra objects (A1-A40) to represent data points. Suitable for high school statistics and probability courses for teaching demonstrations and data analysis practice.
GeoGebra Commands & Parameters
454162533547343449413738343240434841394957413839525135303936434936473147375742454245624342484956386030404237763953453662