
A Sphere and the Pythagorean Theorem
Loading the math board and drawing, please wait…
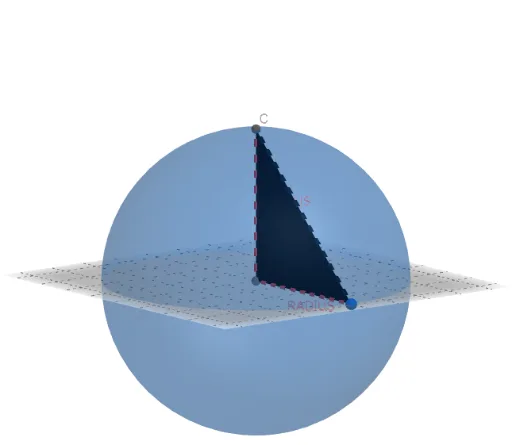
This GeoGebra example demonstrates the Pythagorean theorem in three-dimensional space using a sphere and associated segments and polygons. It visually explores how the theorem extends from planar right triangles to spatial configurations involving a sphere's radius and distances between points. Core mathematical concepts include the sphere equation, spatial distance, right-triangle relationships, and intersections of geometric objects. The construction employs GeoGebra commands such as Intersect to find intersection points, Point to define vertices, Sphere to create the sphere, Segment to draw edges, and Polygon to form faces, with auxiliary objects (a, b, c, t1, t2, etc.) linking the geometry. Suitable for high school and college students studying solid geometry or vector algebra, this example serves as an interactive tool for teaching the spatial generalization of the Pythagorean theorem and enhancing spatial reasoning.
GeoGebra Commands & Parameters
Intersect(yAxis, zAxis) → APoint(xAxis) → BSphere(A, B) → aIntersect(zAxis, a, 2) → CSegment(C, B) → fSegment(A, B) → gSegment(A, C) → hPolygon(C, A, B) → t1, b, c, a_1Polygon(C, A, B) → t2, b_1, c_1, a_2
AI Drawing Prompt Reference
Draw a 3D coordinate system with x, y, and z axes. Place a point at the intersection of the y-axis and z-axis, and another point on the x-axis. Using the y-z intersection as the center and the distance to the x-axis point as the radius, create a sphere. The sphere intersects the z-axis at two points; choose one. Connect this z-axis point to the x-axis point, connect the center to the x-axis point, and connect the center to the z-axis point, forming three segments. Use these segments and the three points to form a triangle, and fill it with color. Repeat the same triangle with a different color or transparency to illustrate the Pythagorean theorem in space.
The prompt above was compiled from the original drawing commands and is for reference only.