
2014-2015 Basketball Point Comparison
Loading the math board and drawing, please wait…
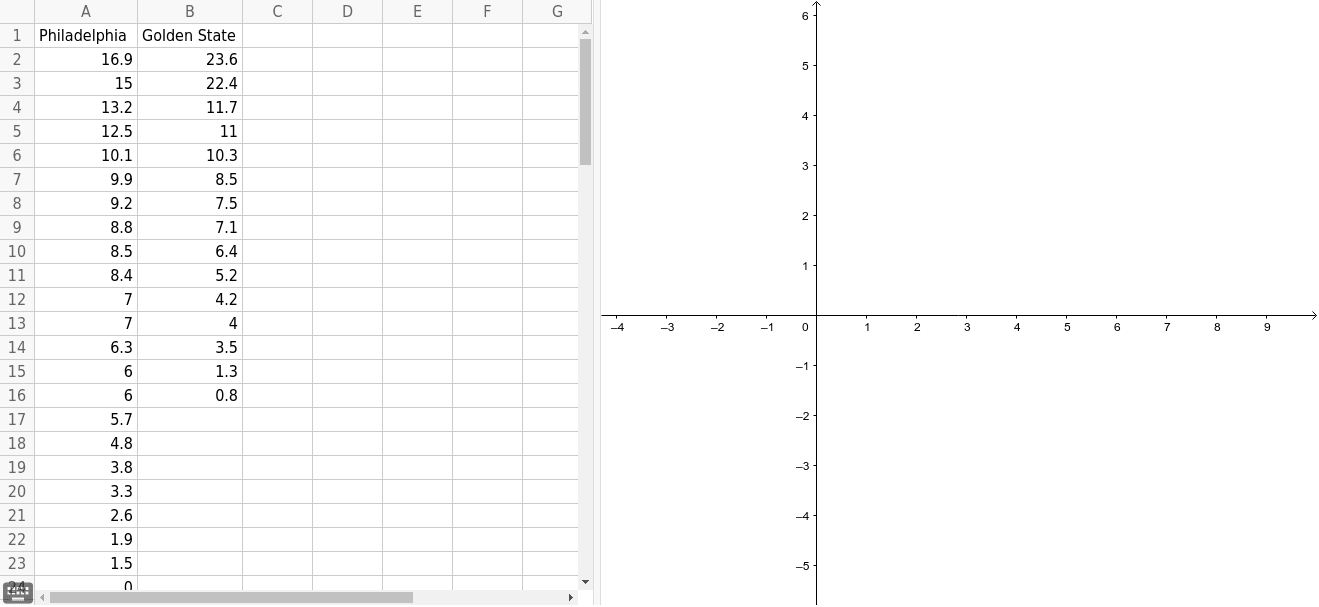
This example demonstrates how to use box plots to compare per-game basketball point statistics from the 2014-2015 season. It involves core math concepts like box plots, statistics, ratios, normal distribution, 3D solids, line segments, and binomial distribution. Constructed using GeoGebra commands, it creates objects (A1-B24) likely representing player/team scores for plotting and analysis. Suitable for high school and above, focusing on data visualization, statistical analysis, and probability applications.
GeoGebra Commands & Parameters
Numeric A2(16.9)Numeric B2(23.6)Numeric A3(15)Numeric B3(22.4)Numeric A4(13.2)Numeric B4(11.7)Numeric A5(12.5)Numeric B5(11)Numeric A6(10.1)Numeric B6(10.3)Numeric A7(9.90000000000005)Numeric B7(8.50000000000005)Numeric A8(9.20000000000005)Numeric B8(7.50000000000005)Numeric A9(8.80000000000005)Numeric B9(7.10000000000005)Numeric A10(8.50000000000005)Numeric B10(6.40000000000005)Numeric A11(8.40000000000005)Numeric B11(5.20000000000005)Numeric A12(7)Numeric B12(4.2)Numeric A13(7)Numeric B13(4)Numeric A14(6.30000000000005)Numeric B14(3.5)Numeric A15(6)Numeric B15(1.3)Numeric A16(6)Numeric B16(0.800000000000005)Numeric A17(5.70000000000005)Numeric A18(4.80000000000001)Numeric A19(3.8)Numeric A20(3.3)Numeric A21(2.6)Numeric A22(1.9)Numeric A23(1.5)Numeric A24(0)