
2.3 One-sided Limits
Loading the math board and drawing, please wait…
In collections
Calculus 1 Graphical Illustrations
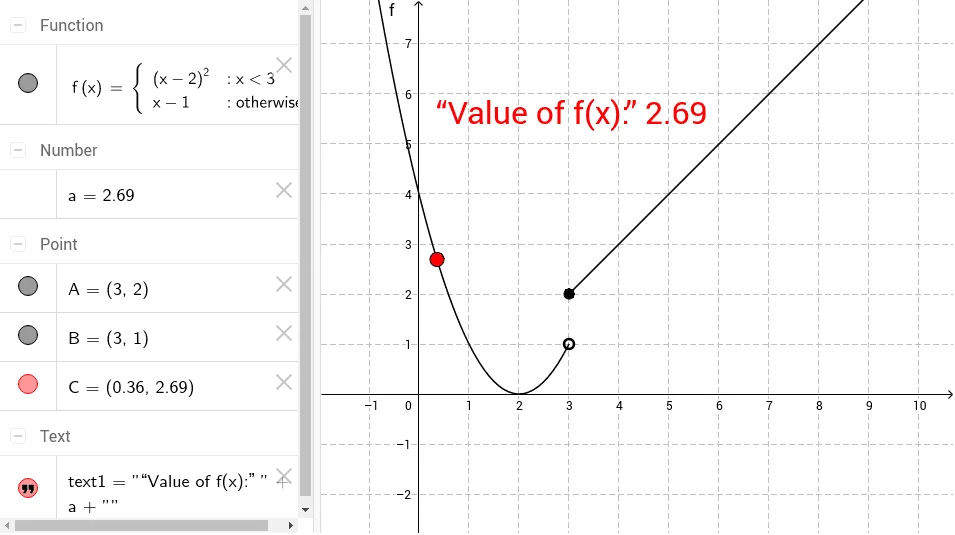
This example demonstrates the concept of one-sided limits by dynamically showing how the limit value of a function changes as it approaches a specific point from either the left or the right. Key math concepts include limit definition, function continuity, and one-sided approximation. GeoGebra commands used are Point for creating key points f, A, B, C, and a as a variable controller, with text1 for displaying text information. Suitable for university calculus beginners or math enthusiasts needing a visual understanding of limits.
GeoGebra Commands & Parameters
Point(f) → APoint(f) → C
AI Drawing Prompt Reference
Draw a function graph showing how its limit value changes as it approaches a specific point from either side, with two points marking the left and right limits of the function at that point, and an adjustable point acting as a controller, along with text annotations explaining the limit definition, function continuity, and one-sided approximation concepts.
The prompt above was compiled from the original drawing commands and is for reference only.