
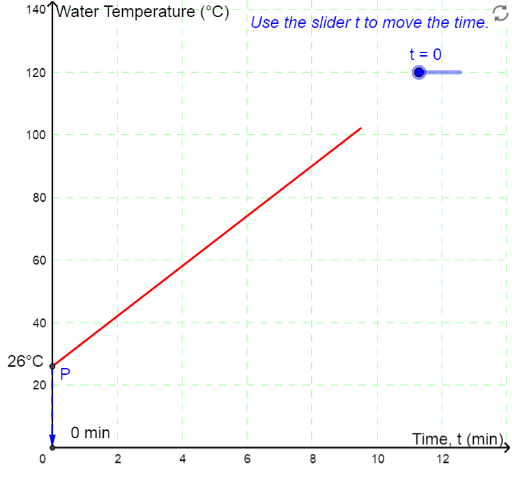
水温随时间变化的温度计图
几何画板及绘图内容加载中,请稍等……
这个范例演示了在恒定加热下水温随时间的变化关系。核心数学概念是函数。通过构造圆、向量、点等对象,展示了温度随时间的线性增长。适合用于教学函数的概念。
GeoGebra 命令及参数
Circle((0, -8), 14) → cIntersect(c, xAxis) → A, BVector(P, P_{xaxis}) → uVector(P, P_{yaxis}) → vPoint(c) → CCircumcircleArc(A, C, B) → dSegment(A, A_t) → aSegment(B, B_t) → bPoint(yAxis) → DCircle(D, B_t) → eIntersect(e, yAxis, 2) → EPolygon(A_{tb}, B_{tb}, B_{tt}, A_{tt}) → poly1, i, j, k, lCircumcircleArc(A_t, E, B_t) → gCircle((0, -8), 8) → hSegment((0, 0), P_{therm}) → themometerline