
线性方程斜率与截距复习
几何画板及绘图内容加载中,请稍等……
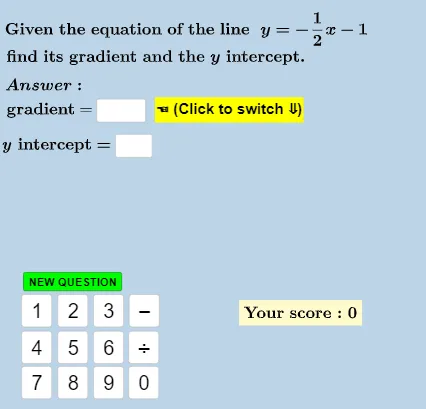
①本范例演示学生如何识别不同形式线性方程(y=mx+c, ax+by=c, ax+by+c=0)的斜率和y截距;②涉及核心数学概念:线性函数、解析几何、斜率、截距;③作图要点:使用RandomElement, Random, Expand, If, Textfield, Coefficients, Intersect, Text, GCD等GeoGebra命令生成随机方程并计算交点;④适合初中及以上学生复习线性方程基础知识。
GeoGebra 命令及参数
RandomElement({0, -4, -3, -2, 1, 0, 1, 2, 3, 4, 1 / 2, 1 / 3, 1 / 4, 3 / 4, 1 / 5, 2 / 3, 1 / 5, 2 / 5, 3 / 5, 4 / 5, -1 / 2, -1 / 3, -1 / 4, -3 / 4, -1 / 5, -2 / 3, -1 / 5, -2 / 5, -3 / 5, -4 / 5}) → mRandom(-6, 7) → cExpand(Simplify[(m * x) + c]) → fRandom(-6, 7) → aRandomElement({1, 2, 3, 4, 5, 6}) → bRandom(-7, 9) → c_1If(counter < 5, 1, If[counter < 8, 2, 3]) → typeIf(type ≟ 1, m, If[type ≟ 2, m_d, m_d]) → m_sIf(m_s ≟ m_{ans}, true, false) → answergradientcorrectIf(type ≟ 1, c, c_d) → c_sIf(c_s ≟ c_{ans}, true, false) → answeryinterceptcorrectTextfield(textanswergradient) → InputBox1Textfield(textansweryintercept) → InputBox2Expand(Simplify[(m_s * x) + c_s]) → f_sCoefficients(f) → l1If(m ≟ 0, "", If[abs(m) ≟ 1, If[m > 0, "x", "-x"], If[m > 0, "" + (FractionText[abs(m)]) + "x", "-" + (FractionText[abs(m)]) + "x"]]) → textCoeffXIf(c ≟ 0, "", If[m ≟ 0, If[c > 0, "" + (FractionText[abs(c)]), "-" + (FractionText[abs(c)])], If[c > 0, "+" + (FractionText[abs(c)]), "-" + (FractionText[abs(c)])]]) → textConstIf(c_s ≟ 0, "", If[m_s ≟ 0, If[c_s > 0, "" + (FractionText[abs(c_s)]), "-" + (FractionText[abs(c_s)])], If[c_s > 0, "+" + (FractionText[abs(c_s)]), "-" + (FractionText[abs(c_s)])]]) → textConst_sIf(m_s ≟ 0, "", If[abs(m_s) ≟ 1, If[m_s > 0, "x", "-x"], If[m_s > 0, "" + (FractionText[abs(m_s)]) + "x", "-" + (FractionText[abs(m_s)]) + "x"]]) → textCoeffX_sIntersect(f_s, yAxis) → AIf(f_s(Max[Denominator[m_s], 4]) > 10, (-Max[Denominator[m_s], 4]), Max[Denominator[m_s], 4]) → x_{P}If(x(A) > x(P), Vector[P, (x(A), y(P))], Vector[A, (x(P), y(A))]) → u_{AP}If(x(P) > x(A), Vector[If[y(P) > y(A), Vector[(x(P), y(A)), P], Vector[(x(P), y(A)), P]]], Vector[If[y(P) > y(A), Vector[(x(A), y(P)), A], Vector[(x(A), y(P)), A]]]) → v_{AP}Text(If[m_s < 0, "−", ""]) → textGradientSignText("run = " + (Length[u_{AP}])) → textRunGCD({abs(a), abs(b), abs(c_1)}) → hcf
AI 绘图提示语参考
画一个线性函数图像,展示其斜率和y轴截距。随机生成斜率和截距,将线性方程转换为不同形式。在坐标系中绘制图像,并用向量标注斜率的水平分量和垂直分量。显示正确的斜率和截距值,让学生识别和输入。
以上提示语为根据原始绘图命令整理而来,仅供参考。