
四分位數與框線圖
几何画板及绘图内容加载中,请稍等……
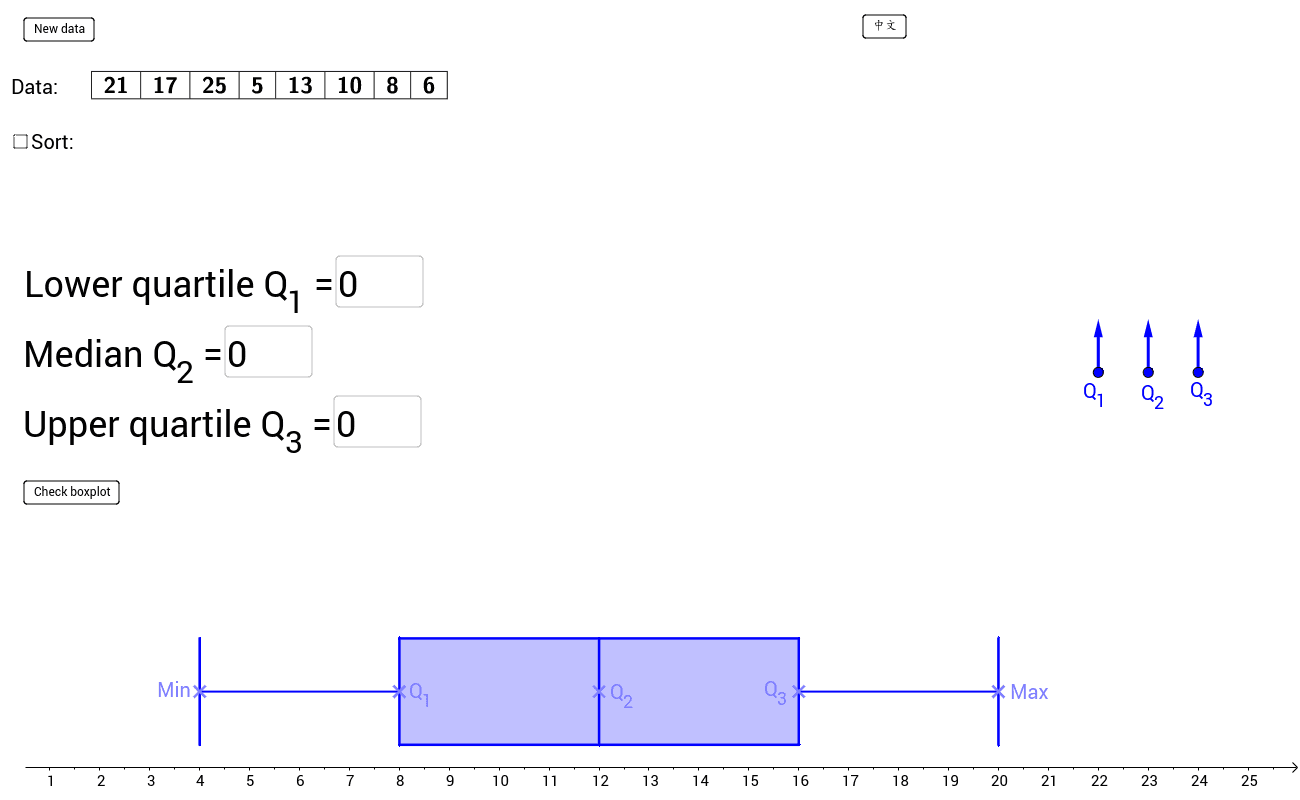
①本范例演示如何根据输入的四分位数(Q1, Q2, Q3)绘制框线图;②涉及的核心数学概念包括四分位数、数据分布、箱线图绘制方法;③作图要点:使用GeoGebra命令如Point, Random, Sequence, Sort, BoxPlot等生成数据并绘制框线图;④适合高中数学教学,用于概率统计相关内容的教学演示。
GeoGebra 命令及参数
Point(L) → H'Point(L) → G'Point(L) → F'Point(L) → E'Point(L) → D'Random(NumberMin, NumberMax) → nVector(A, A + (0, 1)) → u_1Vector(B, B + (0, 1)) → u_2Vector(C, C + (0, 1)) → u_3Sequence(Random[DataMin, DataMax], i, 1, n) → list1Sort(list1) → list2TableText({list2}, "c|_") → text1TableText({list1}, "c|_") → text2Q1(list2) → Q_1Q3(list2) → Q_3Median(list2) → Q_2Textfield(input1) → inputBox1Textfield(input2) → inputBox2Textfield(input3) → inputBox3DynamicCoordinates(D', round(2 * x(D')) / 2, round(2 * y(D')) / 2) → DDynamicCoordinates(E', round(2 * x(E')) / 2, round(2 * y(E')) / 2) → EDynamicCoordinates(F', round(2 * x(F')) / 2, round(2 * y(F')) / 2) → FDynamicCoordinates(G', round(2 * x(G')) / 2, round(2 * y(G')) / 2) → GDynamicCoordinates(H', round(2 * x(H')) / 2, round(2 * y(H')) / 2) → HSegment(D, E) → sh1Segment(G, H) → sh2Polygon(E + (0, 1), E - (0, 1), G - (0, 1), G + (0, 1)) → boxplot2, a, b, c, dSegment(D - (0, 1), D + (0, 1)) → s1Segment(F - (0, 1), F + (0, 1)) → s3Segment(H - (0, 1), H + (0, 1)) → s5BoxPlot(4, 0.5, list2) → boxplotIf(Chinese, "數據:", "Data:") → text3If(Chinese, "←正確", "←Correct") → text4If(Chinese, "←正確", "←Correct") → text5If(Chinese, "←正確", "←Correct") → text6If(Chinese, "←不正確", "←Incorrect") → text7If(Chinese, "←不正確", "←Incorrect") → text8If(Chinese, "←不正確", "←Incorrect") → text9If(Chinese, "框線圖正確!", "Correct boxplot!") → text10If(Chinese, "部分出錯 ...", "something wrong ...") → text11
AI 绘图提示语参考
绘制一个箱线图,展示数据分布。首先生成一组随机数据点,并计算其第一四分位数、第三四分位数和中位数。用线段连接四分位数和中位数,形成箱体。在箱体上下各绘制一条水平线段,表示数据的范围。最后,在箱线图旁边标注数据点和四分位数的具体数值。
以上提示语为根据原始绘图命令整理而来,仅供参考。