
绘制斜截式/标准式线性方程图像
几何画板及绘图内容加载中,请稍等……
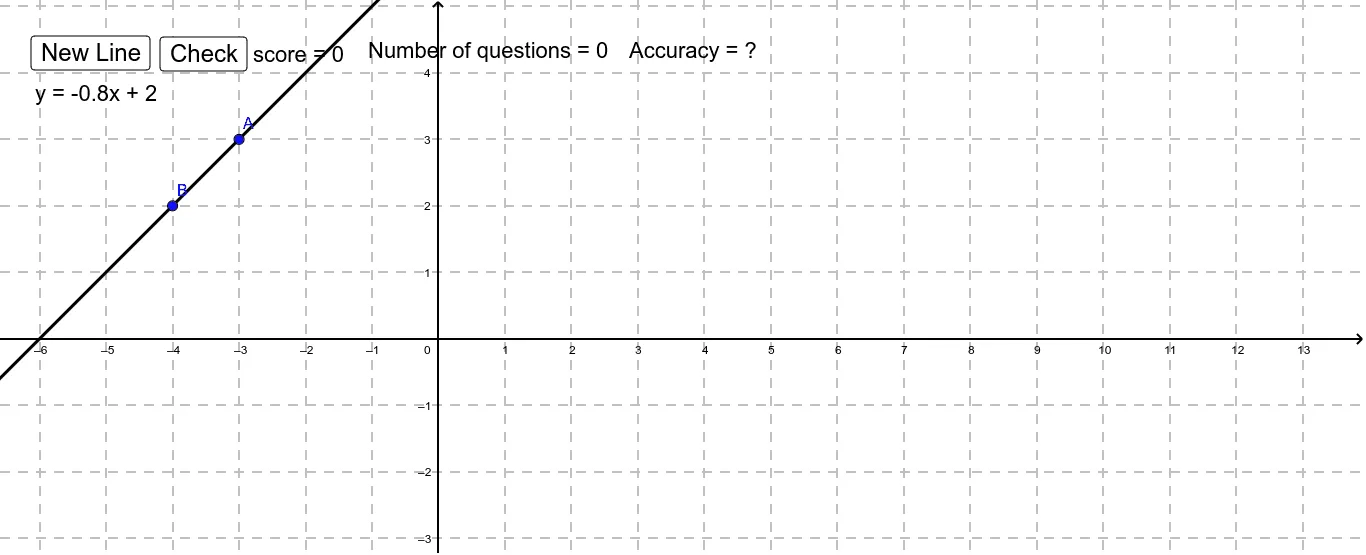
①本范例演示如何使用 GeoGebra 绘制斜截式和标准式线性方程的图像;②涉及的核心数学概念包括线性方程、斜率、截距、解析几何;③作图要点:使用了 Line 命令绘制直线,RandomElement 和 Random 命令生成随机数据,Text 命令添加文本说明,还涉及 score, A, B, a, m, b, l1, l2, r, text1, correct, Incorrect, check, sameline1, sameline2, button1, button2, text2, text3, problems, accu, questions, accur 等对象;④适合高中数学学生学习和理解线性方程的图像绘制方法。
GeoGebra 命令及参数
Line(A, B) → aRandomElement({-4, -3, -2.5, -2, -1.5, -1, -0.8, -0.75, -0.6, -0.5, -0.4, -0.25, -0.2, 0.2, 0.25, 0.4, 0.5, 0.6, 0.75, 0.8, 1, 1.5, 2, 2.5, 3, 4}) → mRandom(-5, 5) → bRandomElement({1, 2}) → rText(("score = " * score)) → text1Text(l1) → text2Text(l2) → text3Text(("Number of questions = " * problems)) → questionsText(("Accuracy = " * accu)) → accur