
动画演示几何变换与概率分布 by Tim Brzezinski
几何画板及绘图内容加载中,请稍等……
所属专题
Geometry Review
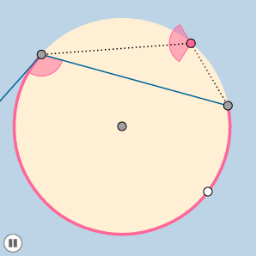
①本范例通过动画演示圆、双曲线、角度变换及概率分布(超几何分布)的几何关系;②涉及核心概念包括角度、圆、双曲线、相关性、概率、超几何分布;③作图要点运用了Circle, Point, Segment, OrthogonalLine, Rotate, CircleArc, Intersect, CircleSector, Dilate, Line, Ray, Vector, Translate等GeoGebra命令;④适合高中及以上数学学习,用于理解几何变换与概率统计的结合应用。
GeoGebra 命令及参数
Circle(A, B) → cPoint(c) → CSegment(A, C) → aOrthogonalLine(C, a) → bRotate(C, °, A) → C'CircleArc(A, C', C) → dPoint(d) → DSegment(D, C) → eCircle(C, (0.2 * a)) → gIntersect(g, b, 2) → EIntersect(g, e, 1) → FSegment(A, C) → hSegment(A, D) → iCircleSector(C, E, F) → kDilate(A, If[0 < j ≤ 1, 1 - j, 0], C) → A'Dilate(A, If[0 < j ≤ 1, 1 - j, 0], D) → A'_1Line(A, e) → nDilate(C, If[3 < j ≤ 4, 4 - j, 0], A) → C'_2CircleArc(A, C, D) → qPoint(b) → JRay(C, J) → rCircleArc(A, D, C) → pPoint(p) → KCircle(K, (0.2 * a)) → sSegment(K, C) → tSegment(K, D) → a_1Intersect(s, t, 1) → LIntersect(s, a_1, 1) → MDilate(K, If[0 < j ≤ 1, 1 - j, 0], C) → K'Dilate(K, If[0 < j ≤ 1, 1 - j, 0], D) → K'_1Segment(K, K') → fSegment(K, K'_1) → lDilate(C, If[1 < j ≤ 2, 2 - j, 0], K) → C'_1Vector(C, C'_1) → uTranslate(k, u) → k'Translate(E, u) → E'Angle(L, K, E') → αRotate(k', If[2 < j ≤ 3, ((j - 2) * ((2 * π) - α)), (2 * π) - α], K) → k''
AI 绘图提示语参考
画一个动画展示几何变换和超几何分布,包含圆形、双曲线、角度和相关性。首先绘制一个圆,然后找到圆上的点和线段,通过旋转和正交线构造双曲线。接着,利用超几何分布的概念,结合角度和相关性,展示几何变换与概率统计的结合。
以上提示语为根据原始绘图命令整理而来,仅供参考。