
估计p值:双比例z检验模拟
几何画板及绘图内容加载中,请稍等……
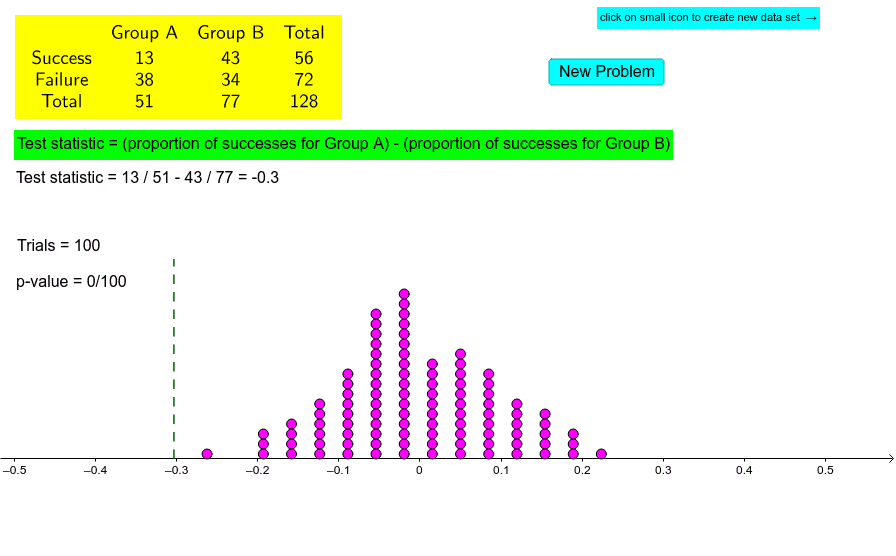
①本范例演示如何通过模拟方法估计双比例z检验的p值;②涉及核心数学概念包括概率统计、假设检验、双比例z检验;③作图要点:使用了Random, TableText, Sequence, Shuffle, Take, CountIf, DotPlot, If, Segment等GeoGebra命令和对象;④适合高中及以上学生或统计学初学者学习假设检验方法。
GeoGebra 命令及参数
Random(10, 60, true) → bfRandom(10, 40, true) → afRandom(10, 50, true) → bsRandom(10, 40, true) → asTableText({header, success, failure, bottom}, "c") → text1Sequence(1, a, 1, as + bs) → ssSequence(0, a, 1, af + bf) → ffShuffle(Join[{ss, ff}]) → list1Take(list1, 1, af + as) → list2Take(list1, af + as + 1, af + as + bf + bs) → list3CountIf(x > -1, data) → bDotPlot(data, true) → list4If(as / (as + af) - bs / (bs + bf) < 0, CountIf[x ≤ as / (as + af) - bs / (bs + bf), data], CountIf[x ≥ as / (as + af) - bs / (bs + bf), data]) → cSegment((as / (as + af) - bs / (bs + bf), 0), (as / (as + af) - bs / (bs + bf), 4)) → d