
二项分布动态演示:概率直方图与正态近似
几何画板及绘图内容加载中,请稍等……
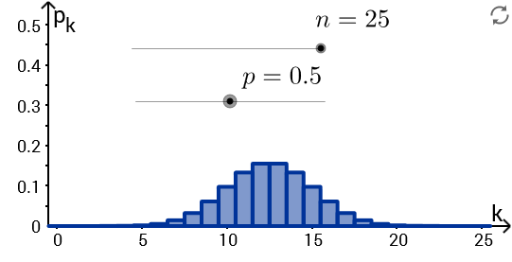
This GeoGebra example dynamically illustrates the binomial distribution's probability mass function and its approximation by the normal distribution. ① It demonstrates how the probability histogram of a binomial distribution approaches a bell-shaped normal curve as the number of trials n increases, visually conveying the central limit theorem. ② Core mathematical concepts include the binomial distribution, probability mass function, expected value μ=np, standard deviation σ=√(npq), continuity correction, and normal approximation. ③ Construction highlights: the Join and Sequence commands generate discrete point sequences; objects d, p, q, n, f, Plotf, mu, sigma, and n_max are defined, where p is the success probability, n is the number of trials, f is the probability function, Plotf renders the histogram, mu and sigma compute distribution parameters, and n_max controls the maximum trials for dynamic adjustment. ④ Suitable for high school to early college probability and statistics courses, it helps students explore how the binomial distribution's shape changes with parameters, the conditions for normal approximation, and interactive statistical concepts via sliders.
GeoGebra 命令及参数
Join({Sequence[((n! / ((i! * (n - i)!)) * p^(i)) * q^(n - i)), i, 0, n], Sequence[0, k, 0, 30]}) → fSequence(Polygon[(i - d, 0), (i + d, 0), (i + d, Element[f, i + 1]), (i - d, Element[f, i + 1])], i, 0, n, 1) → Plotf
AI 绘图提示语参考
绘制一个动态二项分布演示图:横轴表示试验次数,纵轴表示概率。图中有一系列竖直的矩形条,每个矩形条的高度对应二项分布的概率质量函数值,矩形条宽度相同且相邻排列,形成概率直方图。同时叠加一条平滑的钟形正态近似曲线,其均值等于试验次数与成功概率的乘积,标准差等于该乘积与失败概率乘积的平方根。随着试验次数增加,直方图逐渐逼近正态曲线。图中包含可调节试验次数和成功概率的滑块,以及显示均值、标准差等参数的文本。
以上提示语为根据原始绘图命令整理而来,仅供参考。