
X-Y Plotting, Curve Fitting, and Area Under the Curve Example
Loading the math board and drawing, please wait…
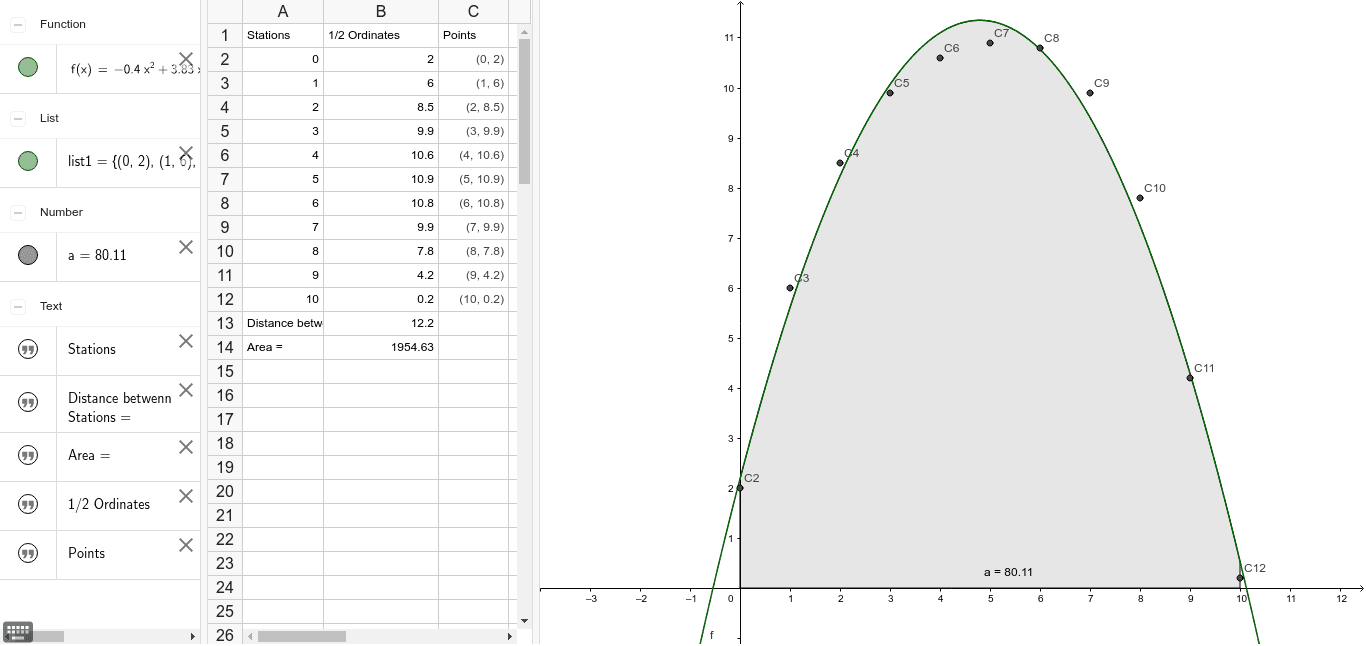
This example demonstrates how to plot functions in a coordinate system using GeoGebra, perform curve fitting, and calculate the area under the curve. Key mathematical concepts include quadratic functions, area computation, and geometric construction. The construction involves using the FitPoly command for curve fitting and the Integral command for area calculation. Suitable for middle school students and above, this example helps in understanding the relationship between function graphs and geometric principles.
GeoGebra Commands & Parameters
FitPoly(list1, 2) → fIntegral(f, 0, 10) → a
AI Drawing Prompt Reference
In a coordinate system, plot a quadratic curve that fits through a set of given data points, showing the smooth function graph. Then, shade the area between this curve and the x-axis over the interval from 0 to 10, and label the value of this shaded region. The overall figure should clearly display the data points, the fitted curve, and the area relationship, making it easy to observe the function's behavior and the integral concept.
The prompt above was compiled from the original drawing commands and is for reference only.