
Water Volume (RO) – Binomial Distribution and Riemann Sums in a Random Experimen
Loading the math board and drawing, please wait…
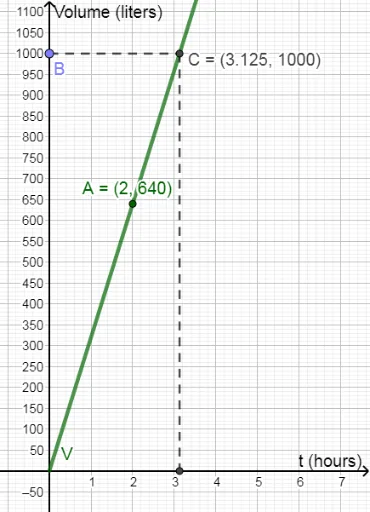
This GeoGebra example dynamically simulates a random experiment for water volume, visually linking the binomial distribution with upper and lower Riemann sums. It demonstrates how random sampling and geometric constructions can illustrate the convergence of discrete probability to continuous integration. Core concepts include volume, binomial distribution, circumcircle, dilation (homothety), random experiments, and Riemann sums (upper and lower). The construction uses commands such as Point to define key points V, A, B, OrthogonalLine to create perpendicular lines g, Intersect to find points C and D, and Segment to draw segments i and j, forming an interactive model. Suitable for high school to undergraduate students, this example helps learners grasp the approximation of binomial probabilities, numerical integration via Riemann sums, and the interplay between geometric transformations and stochastic processes.
GeoGebra Commands & Parameters
Point(yAxis) → BOrthogonalLine(B, yAxis) → gIntersect(V, g) → COrthogonalLine(C, xAxis) → hIntersect(h, xAxis) → DSegment(C, D) → iSegment(B, C) → j
AI Drawing Prompt Reference
Draw a dynamic simulation of a random experiment for water volume, showing the relationship between binomial distribution and upper and lower Riemann sums. Start by creating point B on the y-axis, then draw a perpendicular line g through B, intersect V with g to get point C, draw a perpendicular line h through C, intersect h with the x-axis to get point D, and finally connect C and D, and B and C to form segments i and j.
The prompt above was compiled from the original drawing commands and is for reference only.