
Volume Equations: Geometric Demonstration of Cone Volume Formula
Loading the math board and drawing, please wait…
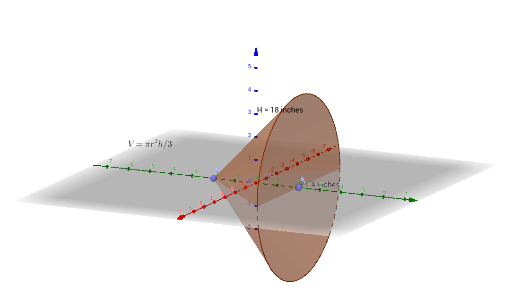
① This GeoGebra example dynamically demonstrates the geometric meaning of the cone volume formula V = 1/3πr²h, using points and a cone to visualize how volume depends on base radius and height. ② Core mathematical concepts include solid geometry (cone volume), exponential and linear functions (describing volume changes with parameters), tangent function and derivative (possibly for analyzing rate of change of volume), and parabola (possibly related to cone cross-sections). ③ Construction highlights: from the summary, the Point command creates key points A and B, the Cone command generates the cone, and variables a, c, b along with text objects text1, text2, text3 are used to label formulas and values. ④ Suitable for middle-to-high school mathematics (grades 9-12) in solid geometry and function integration, also useful for introductory calculus to explore volume change rates, or as a dynamic teaching aid for students to interactively investigate how parameters affect volume.
GeoGebra Commands & Parameters
Point(yAxis) → APoint(yAxis) → BCone(A, B, 4) → a, c, b
AI Drawing Prompt Reference
Draw a 3D coordinate system with two points on the vertical axis, one as the apex and the other as the center of the base. Connect these points to form the axis of a cone with a base radius of 4. Add three text labels nearby, showing the volume formula, the base radius, and the height values. The overall scene is a dynamic geometric illustration demonstrating how the cone's volume changes with its base radius and height.
The prompt above was compiled from the original drawing commands and is for reference only.