
Visualizing Volume of Rotation: From Rectangles to Cones and Pyramids
Loading the math board and drawing, please wait…
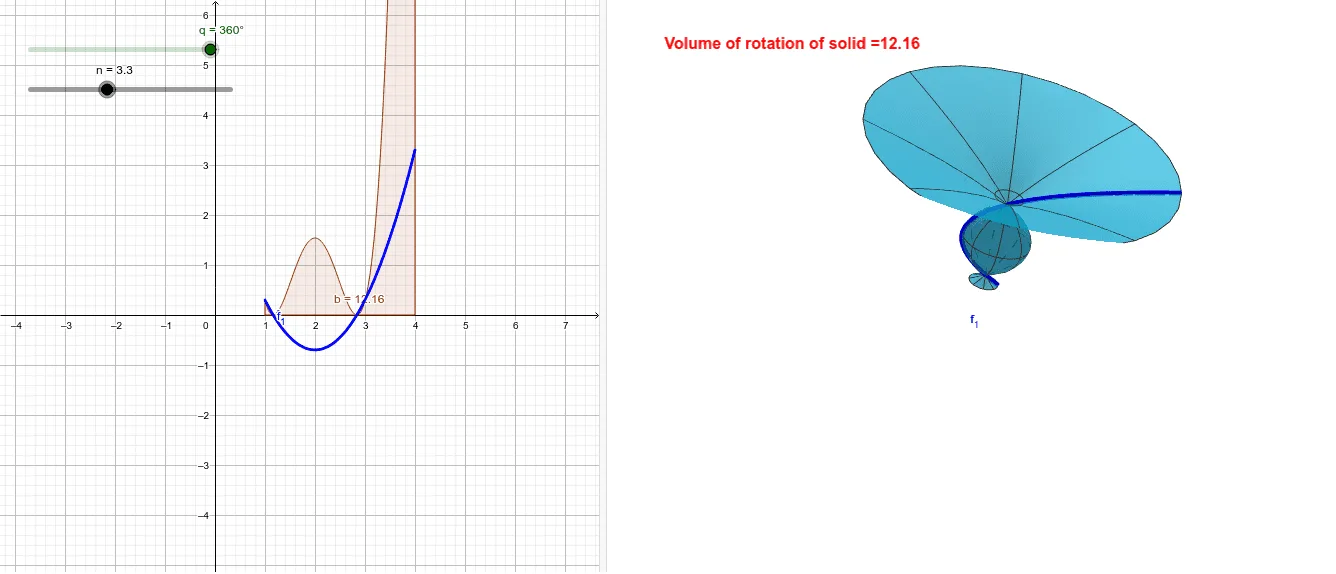
This GeoGebra example dynamically demonstrates how a plane figure (such as a rectangle or a function curve) rotates around an axis to form a solid of revolution, and computes its volume. The core mathematical concepts include definite integrals (volume of revolution formula), geometric transformations (rotation), and the relationship between prisms/pyramids and cylinders/cones. Construction highlights: the Rotate command is used to rotate objects (e.g., rectangles or function graphs) to generate the surface of the solid, the Surface command constructs the 3D surface, the Integral command calculates the definite integral value, and sliders (n), functions (f), parameters (a, b), and text (text1) are used to dynamically update the volume. This is suitable for high school or early college students learning the geometric meaning of volume of revolution in calculus, and for exploring how the volume depends on the base shape (rectangle vs. triangle), as well as comparing volume formulas for pyramids and cones.
GeoGebra Commands & Parameters
Rotate(f, q, xAxis) → f_1Surface(f, q, xAxis) → aIntegral((π * f(x)^(2)), 1, 4) → b
AI Drawing Prompt Reference
Visualize how a plane figure, such as a rectangle or a function curve, rotates around an axis to form a solid of revolution, and calculate its volume. The image should include the rotating plane figure, the generated surface of the solid, and the volume calculation result, all dynamically adjustable by sliders and functions. First, draw the rotating plane figure, then generate the surface of the solid, and finally calculate and display the volume.
The prompt above was compiled from the original drawing commands and is for reference only.