
Visualization of Natural Number Multiplication
Loading the math board and drawing, please wait…
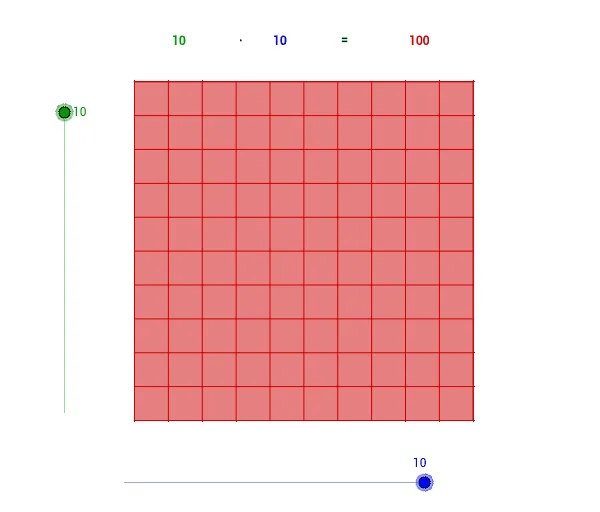
This example demonstrates the multiplication of natural numbers through a visual approach. It involves core mathematical concepts such as multiplication, natural numbers, sequences, LCM and GCD, scatter plots, perimeter, prisms, and expected value. The construction utilizes GeoGebra commands and objects like Point, Segment, OrthogonalLine, Circle, Intersect, Line, Polygon, and Sequence. Suitable for middle school and above, it helps learners understand the geometric meaning of multiplication and related concepts.
GeoGebra Commands & Parameters
Point(Circle[A, Columns]) → BSegment(A, B) → aOrthogonalLine(A, a) → bOrthogonalLine(B, a) → cCircle(A, Rows) → dIntersect(d, b, 2) → CLine(C, a) → eIntersect(c, e) → DPolygon(A, B, D, C) → poly1, a_1, b_1, d_1, c_1Sequence(Segment[A + i * (1, 0), C + i * (1, 0)], i, 1, Columns) → list1Sequence(Segment[A + i * (0, 1), B + i * (0, 1)], i, 1, Rows) → list2
AI Drawing Prompt Reference
Draw a rectangular grid to visualize multiplication of natural numbers. Start with a bottom-left point, mark points to the right at equal intervals for the number of columns, and points upward at equal intervals for the number of rows. Construct a rectangle using the bottom edge and left edge as adjacent sides. Inside the rectangle, draw all horizontal and vertical dividing lines at equal intervals, creating a neat array of unit cells. Each cell represents one unit area, and the whole grid shows the product of rows and columns.
The prompt above was compiled from the original drawing commands and is for reference only.