
Upper and Lower Sums: Approximating Area Under a Curve
Loading the math board and drawing, please wait…
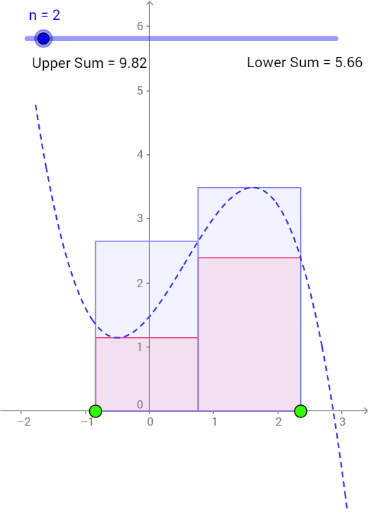
① This example dynamically demonstrates the upper sum (UpperSum) and lower sum (LowerSum) of a function over an interval, visually showing how Riemann sums approximate the definite integral. ② Core mathematical concepts include the geometric meaning of definite integrals, Riemann sums, the concept of limits, and how approximation error decreases as the number of subdivisions increases. ③ Construction details: using GeoGebra commands Point, LowerSum, and UpperSum to create the sums, with a slider n controlling the number of partitions, and text objects text1 and text2 displaying numerical results; auxiliary elements include a general quadrilateral and its circumcircle. ④ Suitable for high school to early college students learning calculus, ideal for understanding integral definitions and numerical approximation, and useful for classroom demonstrations.
GeoGebra Commands & Parameters
Point(xAxis) → DPoint(xAxis) → CPoint(Segment[C, D]) → BPoint(Segment[C, D]) → ALowerSum(g, x(A), x(B), n) → cUpperSum(g, x(A), x(B), n) → b
AI Drawing Prompt Reference
Draw a function curve and approximate the area under it between two points on the x-axis using two sets of rectangles: one set (lower sum) entirely below the curve, and another set (upper sum) slightly above the curve. The number of rectangles is controlled by a slider, with more rectangles giving a finer approximation. Place two points on the x-axis to define the interval, and two additional points inside the interval to set the rectangle boundaries. Display two numerical values near the graph, representing the lower and upper sums. The visual should clearly show how the rectangles approximate the area under the curve, illustrating the concept of limits.
The prompt above was compiled from the original drawing commands and is for reference only.