
Tricky Graphics: Derivative at x=0
Loading the math board and drawing, please wait…
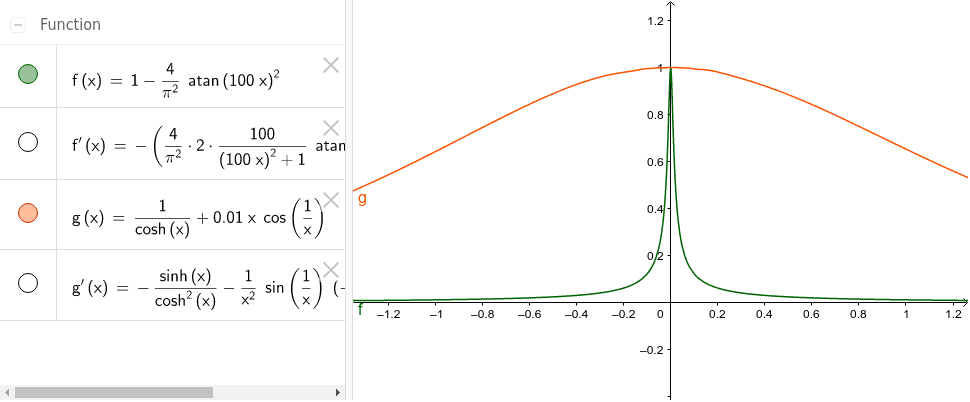
① This example demonstrates a cleverly designed function graph that explores the derivative (tangent slope) at x=0, highlighting potential special cases such as non-differentiability or discontinuous derivative. ② Core mathematical concepts include the geometric meaning of derivatives, limit ideas in differential calculus, and the criterion for differentiability at a point; it also touches on Poisson distribution, linear functions, and linear equations as background, but the main focus is on derivatives. ③ Construction highlights: Based on the summary, GeoGebra objects f, g, f', and g' are used to plot the original functions and their derivatives, comparing the tangent slope behavior at x=0, possibly with sliders or dynamic animations to observe changes under different parameters. ④ Suitable for senior high school or early university students learning calculus, useful for understanding boundary cases of derivative definitions, and as a classroom demonstration to clarify common misconceptions like 'differentiable implies continuous'.
GeoGebra Commands & Parameters
f(x) = 1 - (4 / π^(2) * atan((100 * x))^(2))g(x) = 1 / cosh(x) + ((0.01 * x) * cos(1 / x))f'(x) = f'(x)g'(x) = g'(x)