
Transformations and the Graph of the Sine Function
Loading the math board and drawing, please wait…
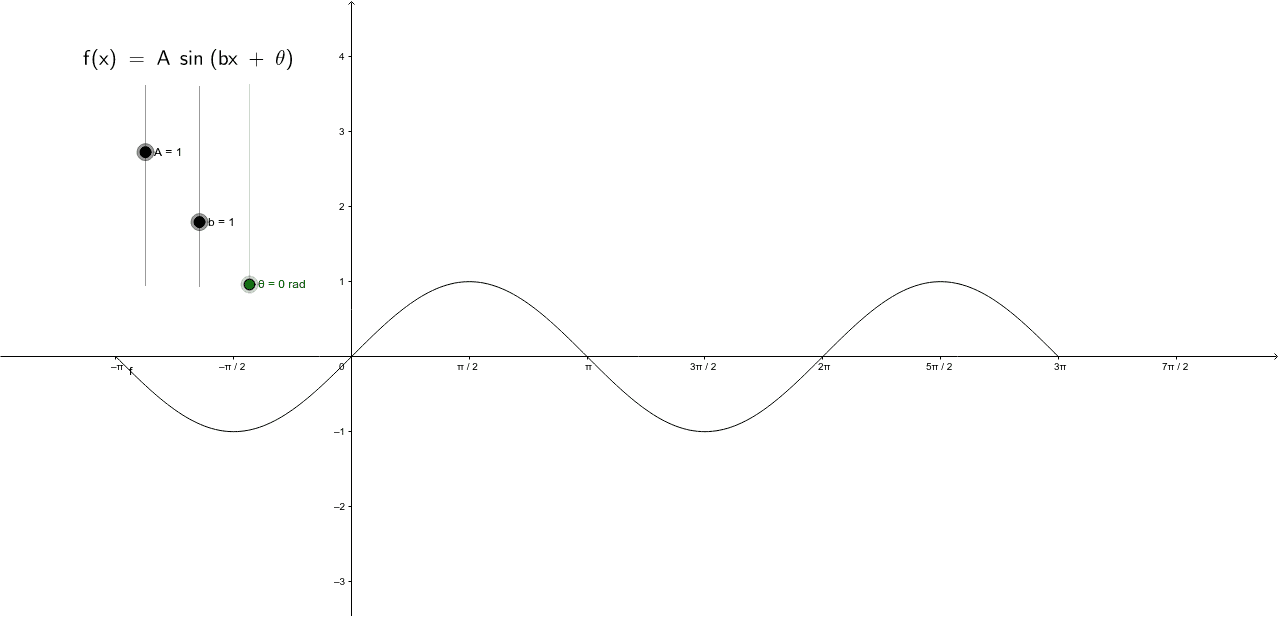
This example demonstrates the transformations of the sine function and its graph. The sine function is a fundamental trigonometric concept, involving periodicity, amplitude, and phase. The construction uses GeoGebra commands such as Function, A, b, θ, f, and text1. Suitable for high school mathematics teaching or student self-study to understand dynamic changes in function graphs.
GeoGebra Commands & Parameters
Function(A * sin(b * x + θ), -3.141592653589793, 9.42477796076938) → f
AI Drawing Prompt Reference
Draw a graph of the sine function to show its periodicity, amplitude, and phase changes. The graph should include a standard sine curve with key points like peaks and troughs. Ensure the graph is clear and easy to understand the changes in the function under different parameters.
The prompt above was compiled from the original drawing commands and is for reference only.