
System of Inequalities Demo by Jesus Perez (2)
Loading the math board and drawing, please wait…
In collections
Linear Inequalities in 2 Variables
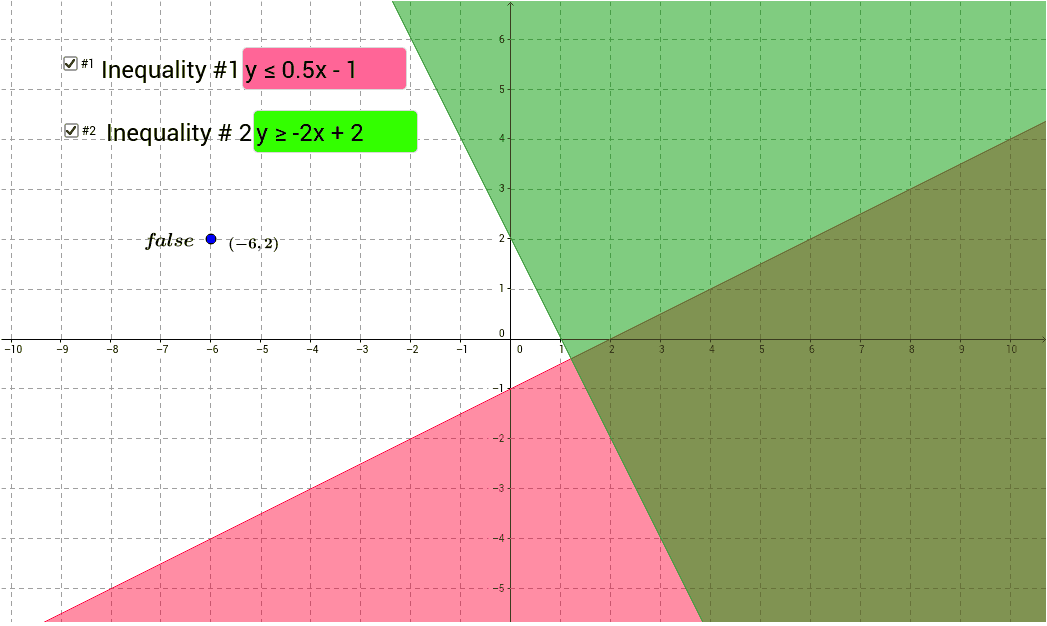
This example demonstrates how to graph the solution set of a system of inequalities in a coordinate plane, visually showing the intersection of different inequality regions. Core math concepts include inequalities, set theory, trigonometric functions (sine), definite integrals, and kite geometry. Construction highlights involve using GeoGebra commands like Textfield for objects such as a, b, c, inputBox1, A, d, e, f, inputBox2, g, text1, etc., enabling parameterized input and dynamic visualization. Suitable for high school and above learners to understand the connection between inequality solving, function graphs, and geometric shapes.
GeoGebra Commands & Parameters
Textfield(c) → inputBox1Textfield(e) → inputBox2
AI Drawing Prompt Reference
Draw a graph in a coordinate plane showing the intersection of multiple inequality regions to demonstrate the solution set. Include parameterized input boxes for variables c and e, allowing dynamic visualization of how changes in these parameters affect the inequality solution regions. Also, incorporate sine function curves, a kite geometry shape, and an integral area to illustrate the connection between inequalities, function graphs, and geometric forms.
The prompt above was compiled from the original drawing commands and is for reference only.