
Sounds (use of exponential functions)
Loading the math board and drawing, please wait…
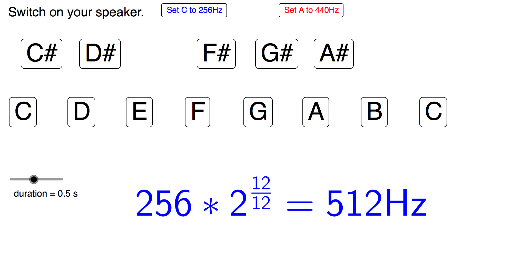
This example dynamically demonstrates the application of exponential functions in the field of sound, visually presenting the relationship between sound amplitude and frequency. It involves core mathematical concepts such as exponential functions, function graphs, upper and lower sums or Riemann sums, and coordinate geometry. Construction highlights include buttons (button1 to button15), texts (text1 and text2), sliders (d), functions (f), and base (baseC) using GeoGebra commands and objects. Suitable for high school students and mathematics enthusiasts learning about function applications and dynamic geometry.
GeoGebra Commands & Parameters
Numeric d(0.5)Numeric baseC(256)f(n) = (baseC * 2^(n / 12))Numeric n(12)
AI Drawing Prompt Reference
Create a dynamic visualization showing the application of exponential functions in the field of sound, featuring a slider ranging from 0.5 to a certain value, an exponential function graph representing sound frequency, and a base of 256 to demonstrate frequency changes through the combination of the slider and base. Include multiple buttons for control and two text labels to explain the content of the graph.
The prompt above was compiled from the original drawing commands and is for reference only.