
Solving Quadratic Equations by KruPongsak Wuttisant _TH (2)
Loading the math board and drawing, please wait…
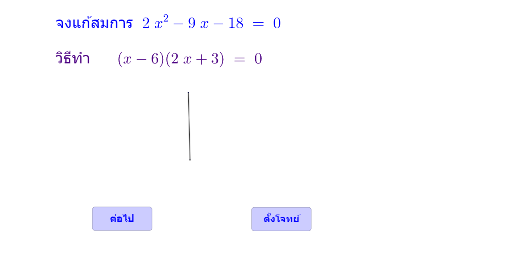
This example demonstrates dynamically solving quadratic equations using GeoGebra, showing the graphical representation of quadratic functions, discriminants, and the relationship between roots and coefficients. Key commands and objects used include Random, GCD, FractionText, and Segment. Suitable for high school mathematics education to understand the geometric meaning and solution methods of quadratic equations.
GeoGebra Commands & Parameters
Random(1, 6) → aRandom(-12, 12) → bRandom(1, 6) → cRandom(-12, 12) → dGCD(a, abs(b)) → ho1GCD(c, abs(d)) → ho2FractionText(e) → text5FractionText(i) → text6Segment(A, B) → j
AI Drawing Prompt Reference
Create a dynamic educational diagram for solving quadratic equations. Show a parabola whose coefficients are randomly generated, along with the discriminant and the relationship between roots and coefficients. Display two fraction texts representing simplified coefficient ratios, and connect two key points with a segment to illustrate root positions. The layout should be clear for high school classroom use, emphasizing the correspondence between the graph and algebraic solutions.
The prompt above was compiled from the original drawing commands and is for reference only.