
Skewed Distributions Demo
Loading the math board and drawing, please wait…
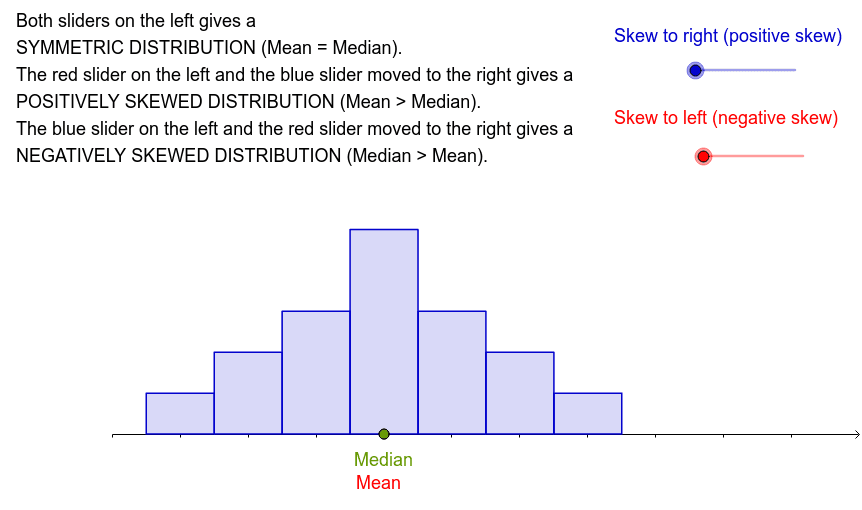
This example demonstrates how to visualize skewed distributions using bar charts, involving key math concepts like probability & statistics, mean, median, and their relationships. It uses GeoGebra commands such as BarChart, Mean, Median, and Intersect with objects like b, a, A1-A7, B1-B7, list1, list2 for constructions. Ideal for high school and above to understand data distribution and statistical measures.
GeoGebra Commands & Parameters
BarChart(list1, list2) → a_1Mean(list1, list2) → cMedian(list1, list2) → dIntersect(e, xAxis) → AIntersect(f, xAxis) → B