
Sine Graph Introduction - in Radians
Loading the math board and drawing, please wait…
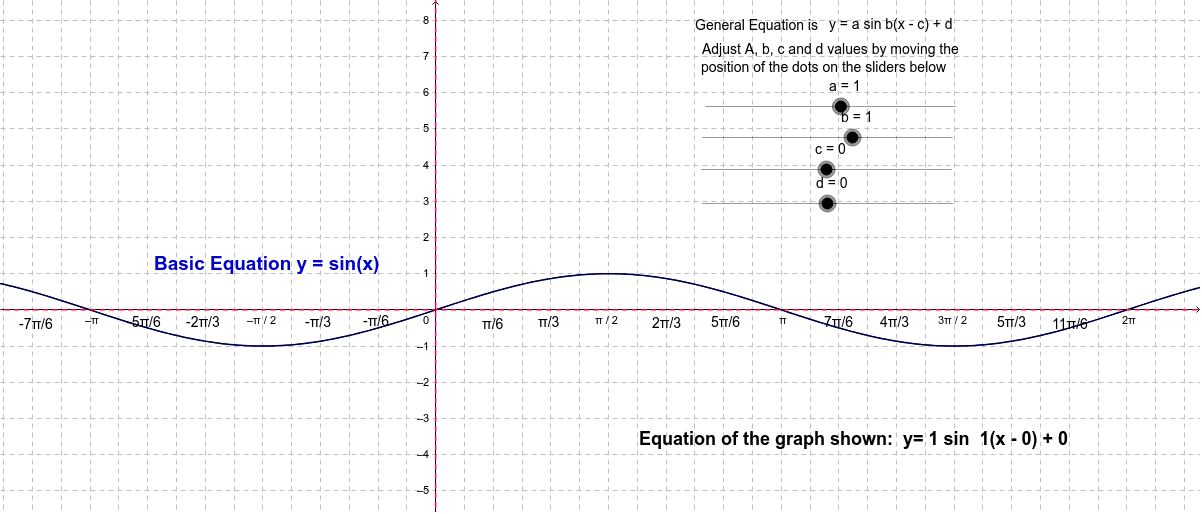
This example demonstrates the plotting of the sine function in a coordinate system, highlighting its periodic properties. Core math concepts include trigonometric functions, coordinate systems, periodicity, radian measure, and graphing techniques. Construction involves commands like objects a (parameter), d (step size), c, b (coordinate points), text series (annotations), a_1, b_1 (auxiliary points), f (function object), and slider animations. Suitable for high school students learning the basic properties of the sine function, serving as an educational aid for function graphing instruction.
GeoGebra Commands & Parameters
Numeric a(1)Numeric d(0)Numeric c(0)Numeric b(1)y = dx = cp(x) = sin(x)f(x) = (a * sin((b * (x - c)))) + d
AI Drawing Prompt Reference
Plot the sine function in a coordinate system to highlight its periodic properties, including the origin, key points on the unit circle, and the sine wave graph, with annotations for the axes and key points, and use a slider to demonstrate the effect of parameter changes on the function graph.
The prompt above was compiled from the original drawing commands and is for reference only.