
Show the Area of a Rectangle
Loading the math board and drawing, please wait…
In collections
Area - Rectangles, Triangles and Parallelograms
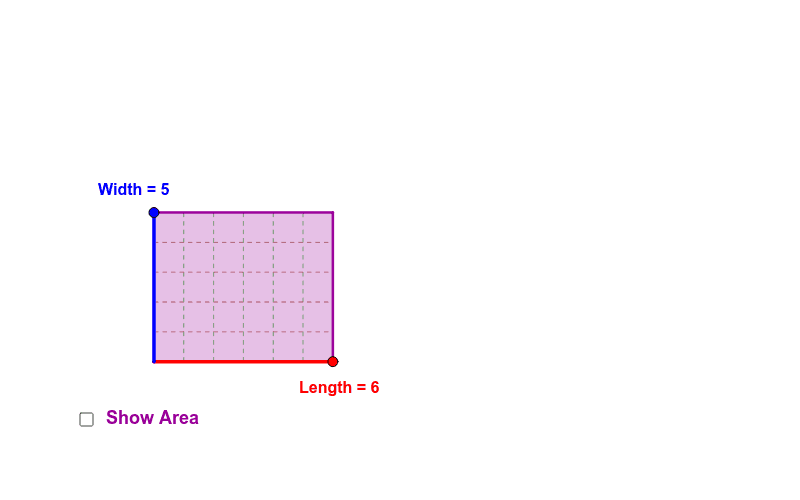
This example demonstrates how to visualize and calculate the area of a rectangle. It involves core math concepts like area, rectangle, and geometric construction. Key GeoGebra commands used include Point, Intersect, Segment, OrthogonalLine, and Polygon. Ideal for introducing area concepts to first-year students, such as in Ireland's primary or secondary education.
GeoGebra Commands & Parameters
Point(xAxis) → B_LPoint(yAxis) → A_TIntersect(xAxis, yAxis) → DSegment(A_B, A_T) → fPoint(f) → APoint(xAxis) → B_RSegment(B_R, B_L) → ePoint(e) → BSegment(ZV1_B, ZV1_T) → zv1Segment(ZV2_B, ZV2_T) → zv2Segment(ZV3_B, ZV3_T) → zv3Segment(ZV4_B, ZV4_T) → zv4Segment(ZV5_B, ZV5_T) → zv5Segment(ZV6_B, ZV6_T) → zv6Segment(ZV7_B, ZV7_T) → zv7Segment(ZV8_B, ZV8_T) → zv8Segment(ZV9_B, ZV9_T) → zv9Segment(ZH1_L, ZH1_R) → zh1Segment(ZH2_L, ZH2_R) → zh2Segment(ZH3_L, ZH3_R) → zh3Segment(ZH4_L, ZH4_R) → zh4Segment(ZH5_L, ZH5_R) → zh5Segment(ZH6_L, ZH6_R) → zh6Segment(ZH7_L, ZH7_R) → zh7Segment(ZH8_L, ZH8_R) → zh8Segment(ZH9_L, ZH9_R) → zh9OrthogonalLine(A, yAxis) → zaOrthogonalLine(B, xAxis) → zbIntersect(za, zb) → CPolygon(D, B, C, A) → P, d, b, c, aPoint(za) → F
AI Drawing Prompt Reference
Draw a rectangle to visualize its area. Start by plotting two intersecting axes, then mark points on both axes. Connect these points to form the four sides of the rectangle. Draw two perpendicular lines from one corner of the rectangle to the x-axis and y-axis respectively, and find their intersection point to determine the fourth vertex. Finally, connect all four vertices to complete the rectangle and label its area.
The prompt above was compiled from the original drawing commands and is for reference only.