
Scale Drawings and Maps
Loading the math board and drawing, please wait…
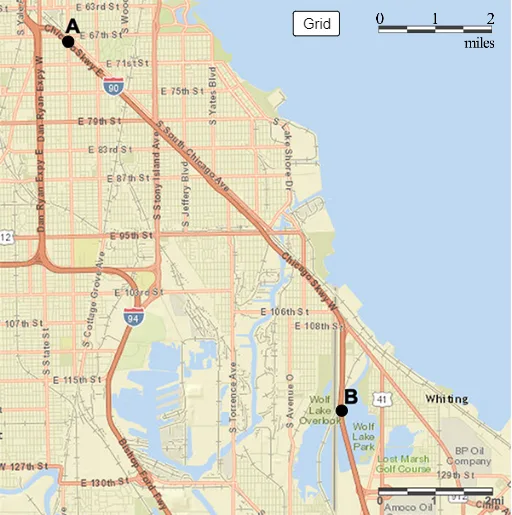
This example demonstrates the creation of scale drawings and maps. Key mathematical concepts include scale, similar figures, and geometric construction. Using GeoGebra commands such as Sequence and objects A_1, B_1, C, the example constructs scale drawings and maps. Suitable for middle school students learning about scale and maps.
GeoGebra Commands & Parameters
Sequence(Line[(0, i), (1, i)], i, -10, 30, 1) → list1, {y = -10, y = -9, y = -8, y = -7, y = -6, y = -5, y = -4, y = -3, y = -2, y = -1, y = 0, y = 1, y = 2, y = 3, y = 4, y = 5, y = 6, y = 7, y = 8, y = 9, y = 10, y = 11, y = 12, y = 13, y = 14, y = 15, y = 16, y = 17, y = 18, y = 19, y = 20, y = 21, y = 22, y = 23, y = 24, y = 25, y = 26, y = 27, y = 28, y = 29, y = 30}Sequence(Line[(i, 0), (i, 1)], i, -10, 30, 1) → list2, {x = -10, x = -9, x = -8, x = -7, x = -6, x = -5, x = -4, x = -3, x = -2, x = -1, x = 0, x = 1, x = 2, x = 3, x = 4, x = 5, x = 6, x = 7, x = 8, x = 9, x = 10, x = 11, x = 12, x = 13, x = 14, x = 15, x = 16, x = 17, x = 18, x = 19, x = 20, x = 21, x = 22, x = 23, x = 24, x = 25, x = 26, x = 27, x = 28, x = 29, x = 30}