
Scale Change Images of Sine Function
Loading the math board and drawing, please wait…
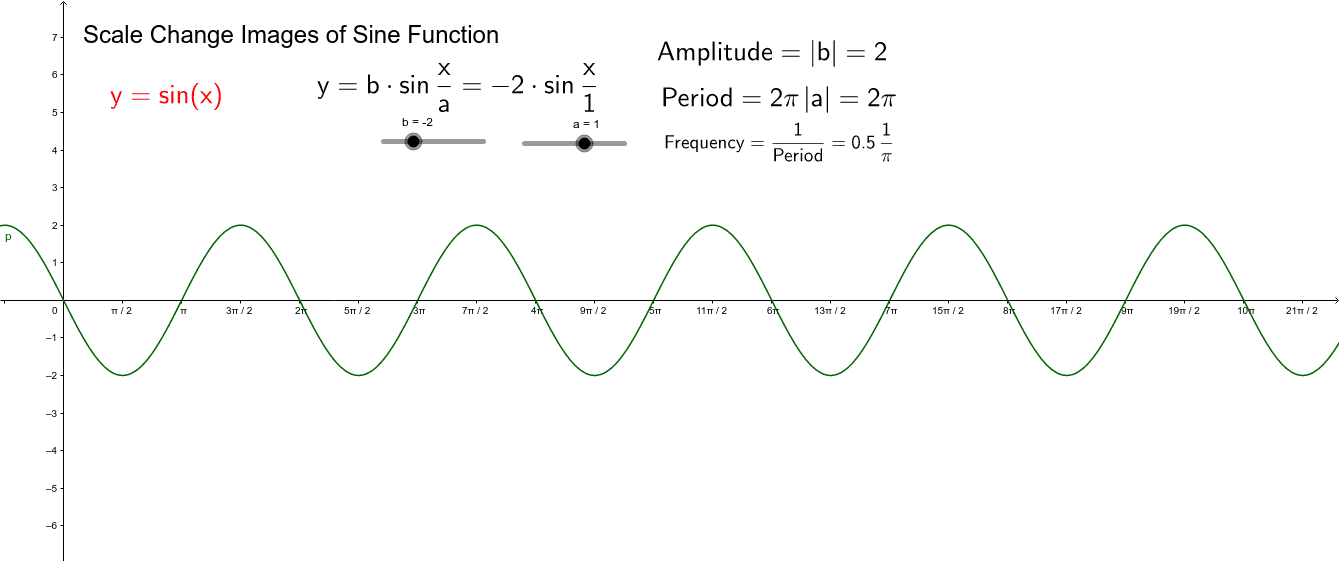
This example demonstrates how the sine function graph changes under scaling parameters a and b. Core math concepts include function graph transformations, similar triangles, median value theorem, definite integral, and function division. Construction highlights involve using If commands, sliders (a, b), text objects (text2-text6), points (c-h), and parameter (p). Suitable for high school mathematics education to understand the effects of function transformations on graphs.
GeoGebra Commands & Parameters
If(a ≠ f, c, a) → g