
Rolling Two Dice
Loading the math board and drawing, please wait…
In collections
Statistics & Probability
Probability Applets
Simulations of Coins and Dice
probability simulations
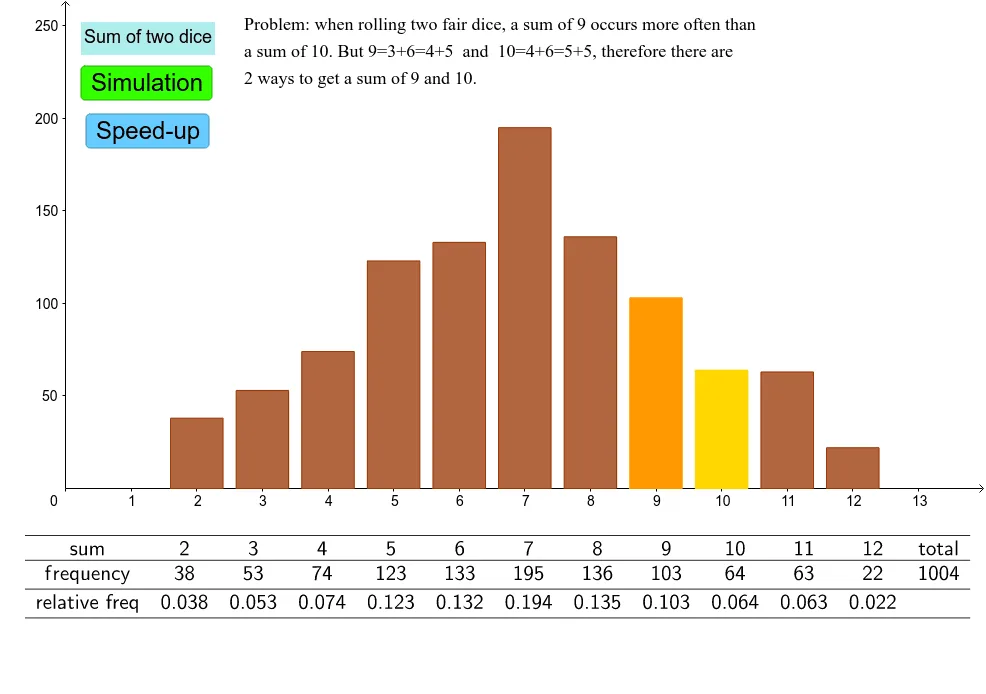
This example demonstrates the process of rolling two dice. The core mathematical concepts involved are probability and statistics. Using GeoGebra commands such as Frequency, Sum, Random, and BarChart, a frequency histogram of dice rolls can be generated. Suitable for middle school and above students to learn probability and statistics.
GeoGebra Commands & Parameters
Frequency(sumlist) → freqSum(freq) → bUnique(sumlist) → list1Random(1, 6) → dice1Random(1, 6) → dice2BarChart(sumlist, 0.8) → aAppend("frequency", freq) → row2Append("sum", list1) → row1Append("relative freq", rel) → row3Append(row1, "total") → row1aAppend(row2, b) → row2aTableText({row1a, row2a, row3}, "c_") → text2
AI Drawing Prompt Reference
Create a frequency histogram for two dice rolls. First, generate random numbers from 1 to 6 to represent the points of two dice. Then, calculate the frequency and unique values of all dice rolls. Finally, display a table showing the frequency and relative frequency.
The prompt above was compiled from the original drawing commands and is for reference only.