
Quadratic Inequalities Solved with Graphs & Symbols
Loading the math board and drawing, please wait…
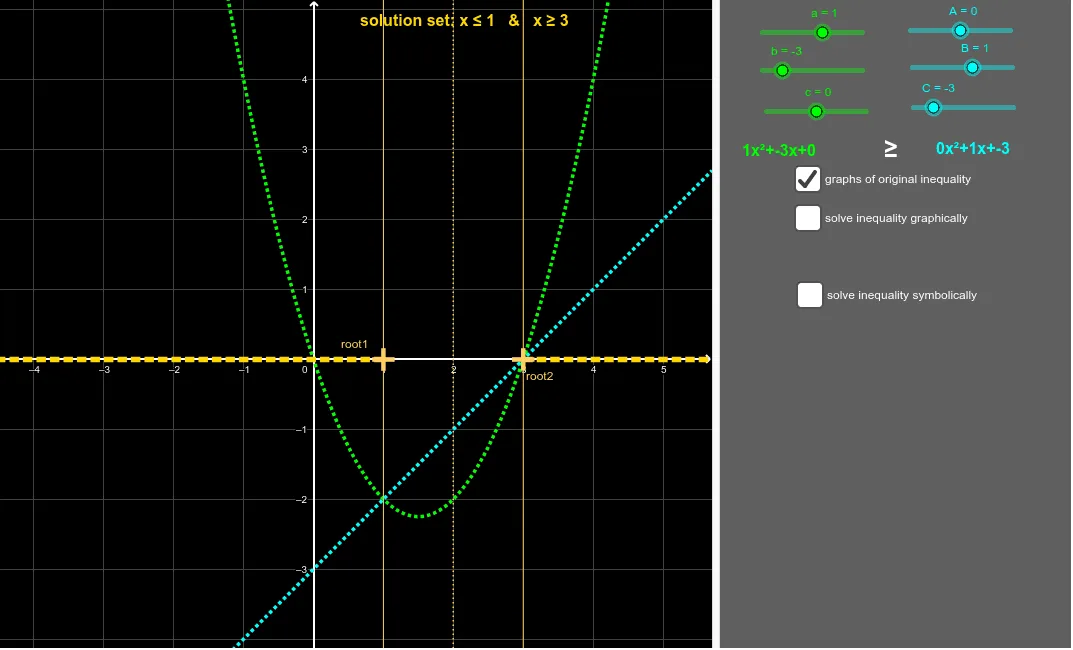
This example demonstrates how to solve quadratic inequalities using graphical and symbolic methods, visually illustrating the relationship between the solution set of inequalities and the function's graph. Core mathematical concepts include quadratic functions, inequality solving techniques, function graph properties, and the relationship between roots and coefficients. GeoGebra commands and objects used in construction include OrthogonalLine, Point, Polynomial, Ray, and Segment. Suitable for high school mathematics students and educators needing a deeper understanding of quadratic inequality solutions.
GeoGebra Commands & Parameters
OrthogonalLine(F, xAxis) → dOrthogonalLine(G, xAxis) → ePoint(e) → DPoint(yAxis) → EPoint(d) → HPoint(yAxis) → IPolynomial({D, E, H}) → gPolynomial({D, I, H}) → qRay(G, (x(G) + 1, 0)) → nRay(F, (x(F) - 1, 0)) → rSegment(F, G) → sSegment((-50, 0), (50, 0)) → t