
Quadratic Equations Demo
Loading the math board and drawing, please wait…
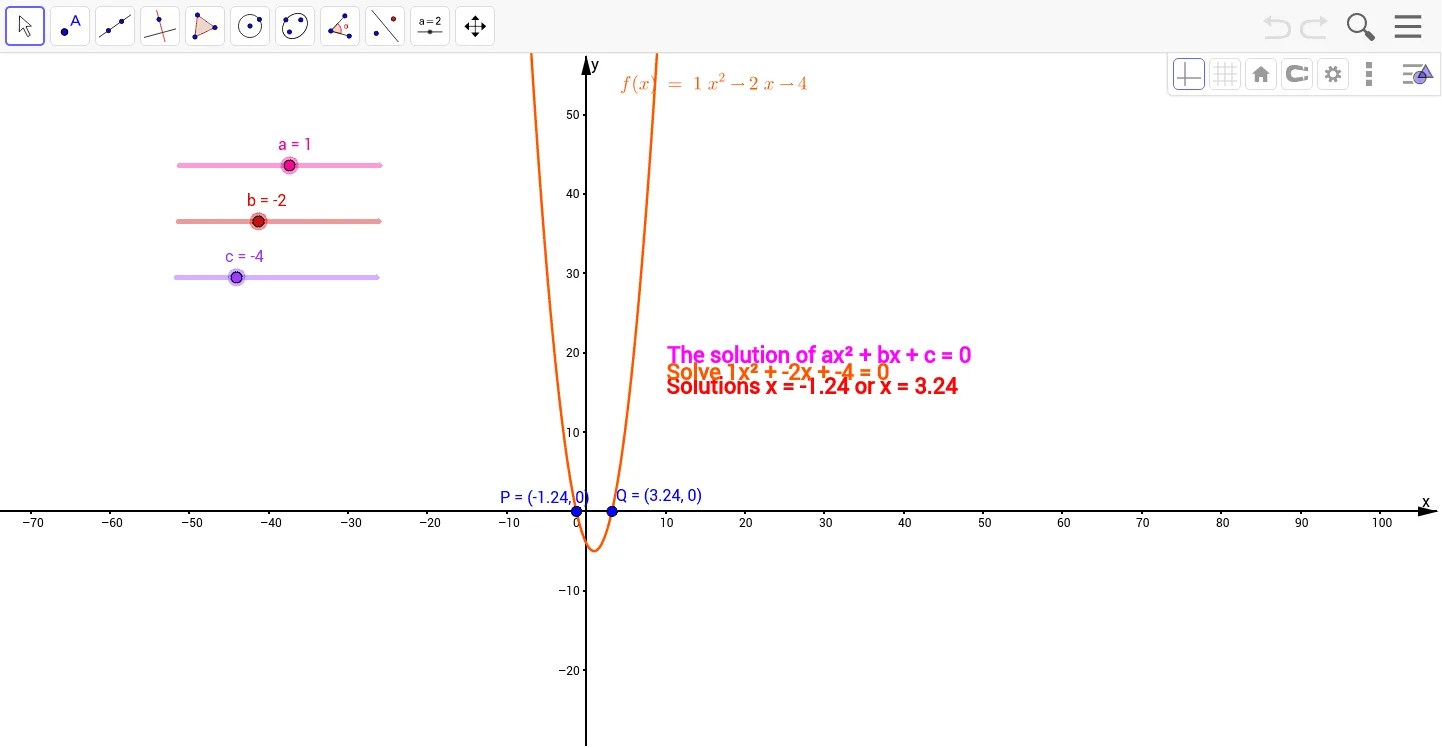
This example demonstrates the relationship between roots and coefficients of quadratic equations and the changes in their graphs. It involves core mathematical concepts such as quadratic functions, roots, coefficients, rotation, area, and statistics. The construction uses GeoGebra commands Root and objects like a, b, c, f, P, Q, d, e, text1, text2, text3. Suitable for high school mathematics teaching and function graph studies.
GeoGebra Commands & Parameters
Root(f) → P, Q
AI Drawing Prompt Reference
Create a demonstration diagram of a quadratic function graph, illustrating the relationship between its roots and coefficients. The graph shows an upward-opening parabola intersecting the x-axis at two points, representing the roots. Above or below the parabola, display three adjustable coefficient values corresponding to the quadratic, linear, and constant terms. Additionally, label the coordinates of the two roots and include text annotations explaining the mathematical relationship between the roots and coefficients, such as the sum and product of roots in relation to the coefficients. The overall layout should be clear and suitable for teaching, emphasizing how the graph changes with coefficient variations.
The prompt above was compiled from the original drawing commands and is for reference only.