
Quadratic Equations and Graph Relationships
Loading the math board and drawing, please wait…
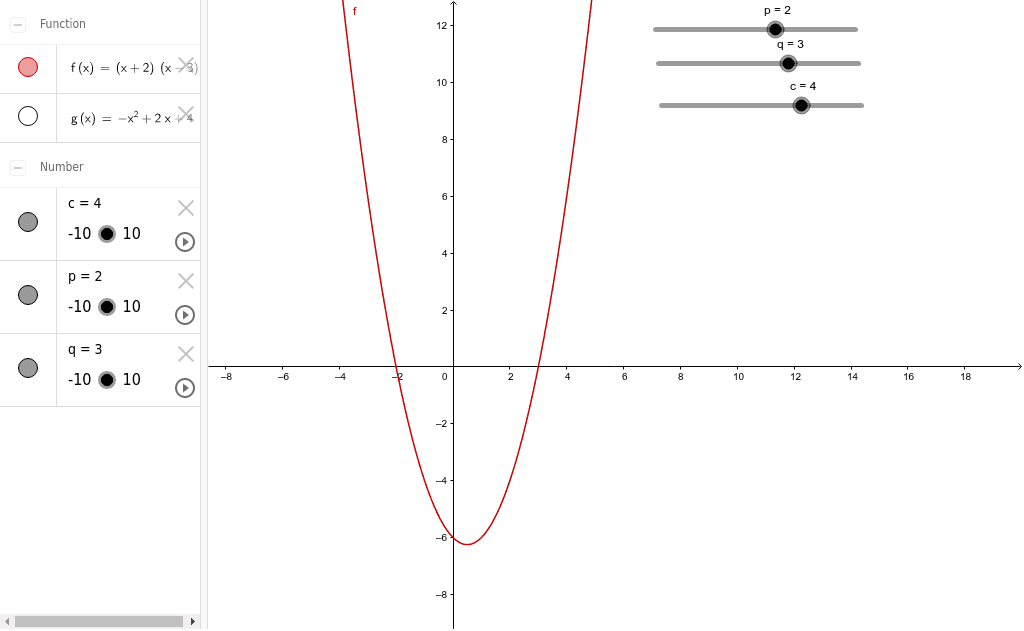
This example demonstrates the relationship between the parameters a, b, c, p, q in a quadratic equation ax^2+bx+c=0 or (x+p)(x+q)=0 and its graph. Key math concepts include quadratic function graphs, the impact of parameters on the graph. Construction highlights the use of GeoGebra commands/objects p, q, c, f, g to dynamically visualize the connection between parameters and the graph. Suitable for high school mathematics education to understand the geometric meaning of quadratic equations and the effect of parameter changes on the graph.
GeoGebra Commands & Parameters
Numeric p(2.0)Numeric q(3.0)Numeric c(4.0)f(x) = ((x + p) * (x - q))g(x) = (-x^(2)) + (2 * x) + c
AI Drawing Prompt Reference
Draw a quadratic function graph with parameters p=2.0, q=3.0, and c=4.0. First, plot points p and q, then construct the quadratic function f(x) = (x + p)(x - q) using p and q as roots. Next, use c as the constant term to construct the quadratic function g(x) = -x^2 + 2x + c. Observe how parameters p, q, and c affect the graph of the quadratic function.
The prompt above was compiled from the original drawing commands and is for reference only.