
Problem 10B: Trapezoid, Fractal Geometry, and Normal Distribution
Loading the math board and drawing, please wait…
In collections
Continuity and Differentiability
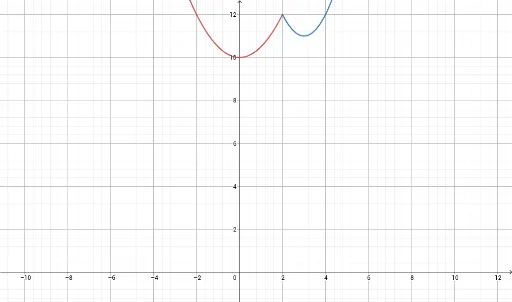
This example demonstrates a geometric construction that combines a trapezoid, fractal geometry, a bar chart, a pyramid, and a normal distribution, likely to illustrate visual connections between diverse mathematical concepts. Core mathematical concepts include properties and area of trapezoids, self-similar structures in fractal geometry, data visualization via bar charts, three-dimensional pyramid shapes, and the probability density curve of a normal distribution. Construction notes: from the summary, only objects f and g are used, possibly representing two functions or geometric objects created via GeoGebra commands, but specific commands are not detailed; it likely involves function plotting, geometric transformations, or sequence generation. This is suitable for high school to university-level mathematics teaching, useful for interdisciplinary projects to help students understand intersections between geometry and statistics, or as exploratory learning material.
GeoGebra Commands & Parameters
f(x) = If[x ≤ 2, (1 / 2 * x^(2)) + 10]g(x) = If[x > 2, x^(2) - (6 * x) + 20]
AI Drawing Prompt Reference
Create a geometric illustration featuring a trapezoid, fractal geometry, a bar chart, a pyramid, and a normal distribution curve. The trapezoid is defined by two piecewise functions: one is x²/2 + 10 for x ≤ 2, and the other is x² - 6x + 20 for x > 2. The fractal may be derived from these functions, while the bar chart and pyramid serve as visual complements. Overlay a normal distribution curve to represent probability density. Start by plotting the functions, then construct the trapezoid and fractal, followed by the bar chart and pyramid to highlight diverse mathematical concepts visually.
The prompt above was compiled from the original drawing commands and is for reference only.