
Probability Tree & Venn Diagrams
Loading the math board and drawing, please wait…
In collections
Set Notation, Venn Diagrams & Probability Trees
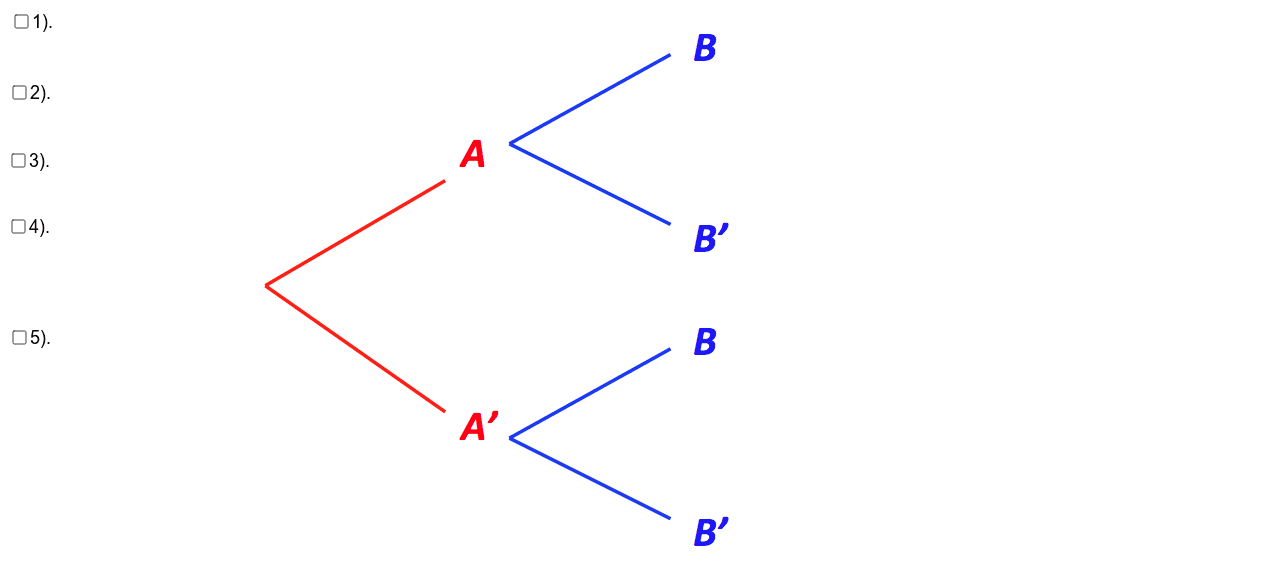
This example demonstrates the construction and relationship between probability trees and Venn diagrams. Key math concepts include probability, conditional probability, and set theory. It utilizes GeoGebra commands like pic2, pic3, pic4, pic5, pic1, pic6, pic7, pic8, pic9, a, text1, pic10, pic11, pic12, text2, b, pic13, pic14, pic15, pic16, text3, c, text4, d, text5, e. Suitable for high school mathematics teaching and probability statistics learning.
GeoGebra Commands & Parameters
Boolean a(false)Boolean b(false)Boolean c(false)Boolean d(false)Boolean e(false)
AI Drawing Prompt Reference
Create a visual representation showing the relationship between probability trees and Venn diagrams, illustrating concepts of probability, conditional probability, and set theory, with multiple boolean controls and text labels, first construct a probability tree, then display a Venn diagram, and include text annotations explaining key concepts and their connections, suitable for high school mathematics education.
The prompt above was compiled from the original drawing commands and is for reference only.