
Pouring Liquid into Cones and Pyramids
Loading the math board and drawing, please wait…
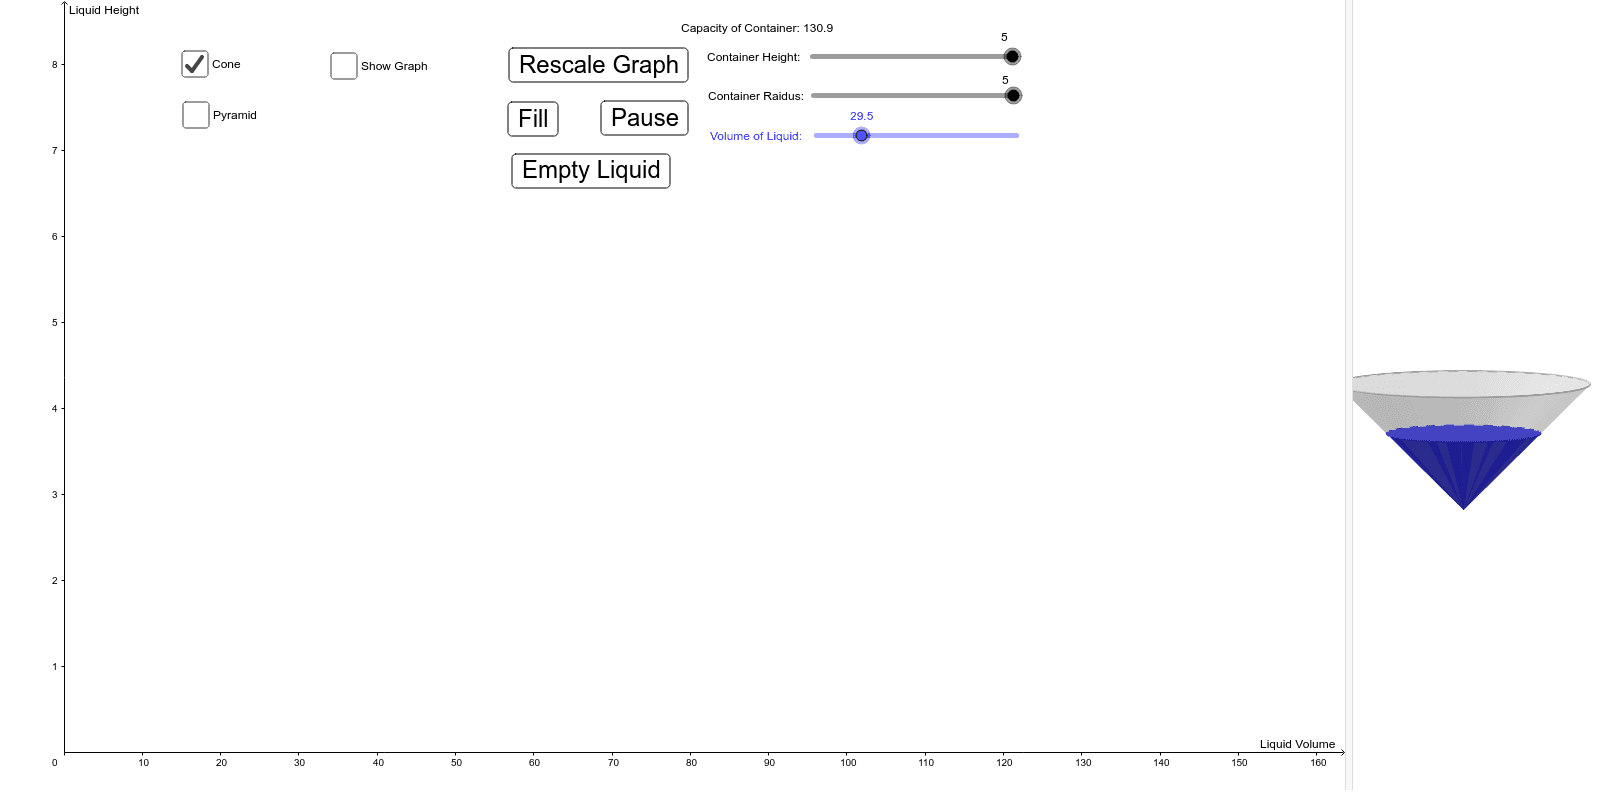
This example demonstrates the relationship between the height and volume of liquid poured into cones and pyramids. Core math concepts include volume calculation, linear regression, and equations. GeoGebra commands construct cones, pyramids, liquid volume, and height, with slider animations to show changes. Suitable for high school solid geometry and mathematical modeling education.
GeoGebra Commands & Parameters
Cone(B, A, contRadius) → a, c, bCone(C, A, liqConeRadius) → d, e, fPyramid(Z, W, X, Y, A) → i, faceWXYZ, edgeAZ, edgeAW, edgeAX, edgeAY, faceAWZ, faceAWX, faceAXY, faceAYZ, edgeWZ, edgeWX, edgeXY, edgeYZPyramid(Y2, Z2, W2, X2, A) → j, faceW2X2Y2Z2, edgeAY2, edgeAZ2, edgeAW2, edgeAX2, faceAY2Z2, faceAW2Z2, faceAW2X2, faceAX2Y2, edgeY2Z2, edgeW2Z2, edgeW2X2, edgeX2Y2
AI Drawing Prompt Reference
Draw a cone and a pyramid to illustrate the relationship between the height and volume of liquid poured into them. The sizes of the cone and pyramid can be adjusted using sliders to dynamically show how the liquid volume changes with height, including linear regression analysis. The image should feature the cone, pyramid, liquid volume, height, and their mathematical relationships.
The prompt above was compiled from the original drawing commands and is for reference only.