
Polynomial Function Graphing
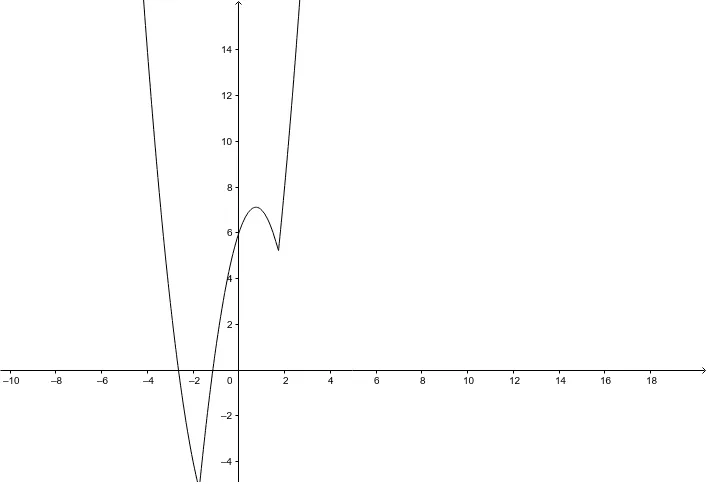
This example demonstrates how to plot polynomial function graphs in GeoGebra, allowing users to observe changes in the function's image by adjusting coefficients via sliders or direct input. The core mathematical concepts covered include the definition of polynomials, function monotonicity, extreme points, and the shape and opening direction of the graph. The construction primarily uses the Function command or direct algebraic input to create object f, with optional slider (Slider) integration for dynamic interaction. Suitable for middle school mathematics courses on function concepts and quadratic function analysis, as well as introductory polynomial function study in pre-university mathematics.
Loading the math board and drawing, please wait…