
Polygon Plotting and Fractal Geometry
Loading the math board and drawing, please wait…
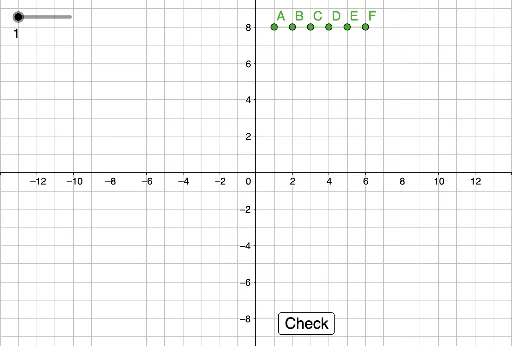
This example demonstrates how to plot polygons and explore fractal geometry using GeoGebra. Key math concepts include polygon construction, matrix operations, confidence intervals, differential calculus, and means. The construction highlights commands like Sequence, First, Polygon, Length, and objects such as checklist, points (P, H, G, ..., A), lists (list1, list2), polygon (poly1), texts (text1, text2, etc.), and buttons (button1, button2). It is suitable for high school and above, illustrating the dynamic generation of polygons and the application of matrices in geometric transformations.
GeoGebra Commands & Parameters
Sequence(Length[Element[checklist, i]], i, 1, 4) → list1First(list2, Element[list1, P]) → plistPolygon(plist) → poly1Length(plist) → pnLength(Intersection[plist, Element[checklist, P]]) → a