
Polar Curve Plotter: Dynamic Input and Negative Radius Visualization
Loading the math board and drawing, please wait…
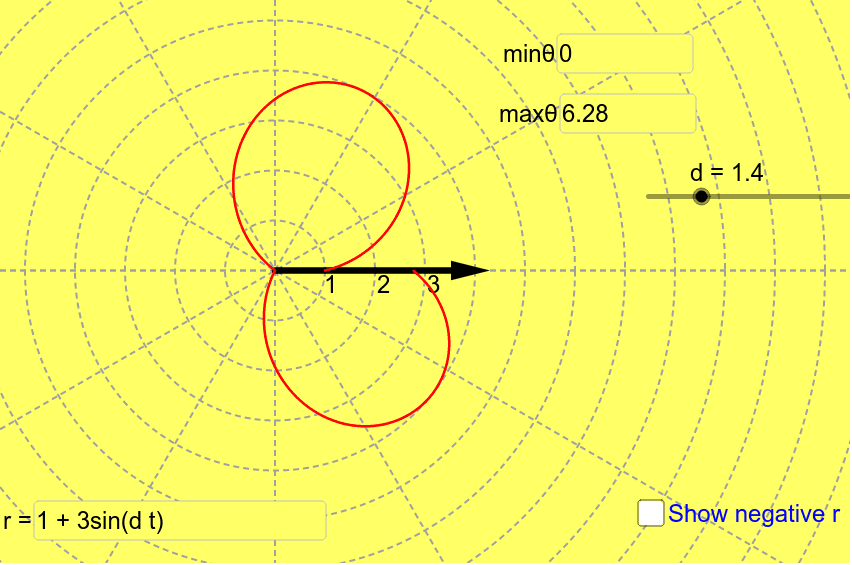
This GeoGebra example demonstrates how to plot polar curves of the form r = f(θ), with negative values of r displayed in a distinct color to highlight their geometric interpretation. It covers core concepts of polar coordinates, the relationship between radial distance and angle, trigonometric functions, and parametric representation. The construction uses input boxes (inputBox1, inputBox2, inputBox3) for users to define the function f(θ) and the angular range (minθ, maxθ), and employs the CurveCartesian command to convert the polar equation into a Cartesian parametric curve for plotting. Additional elements like Vector and Textfield are used to build an interactive interface. This resource is suitable for high school or early college students learning polar coordinates, function graphing, and parametric equations, as well as for teachers demonstrating how different polar equations (e.g., rose curves, spirals) change with parameters.
GeoGebra Commands & Parameters
Vector(L, M) → uTextfield(f) → inputBox1CurveCartesian((cos(t) * g(t)), (sin(t) * g(t)), t, minθ, maxθ) → bCurveCartesian(((-cos(t)) * h(t)), ((-sin(t)) * h(t)), t, minθ, maxθ) → cTextfield(maxθ) → inputBox2Textfield(minθ) → inputBox3
AI Drawing Prompt Reference
Plot a polar curve where the radial distance is defined by a user-input function, with adjustable angular range. The graph includes two curves: one in a default color for positive radius values, and another in a distinct color for negative radius values, highlighting their geometric interpretation. Three input fields allow the user to enter the function expression, the maximum angle, and the minimum angle. The curve is drawn by converting the polar equation into Cartesian parametric form, and a vector indicates direction. This setup demonstrates how different polar equations (e.g., rose curves, spirals) change with parameters.
The prompt above was compiled from the original drawing commands and is for reference only.